
Figure 2.
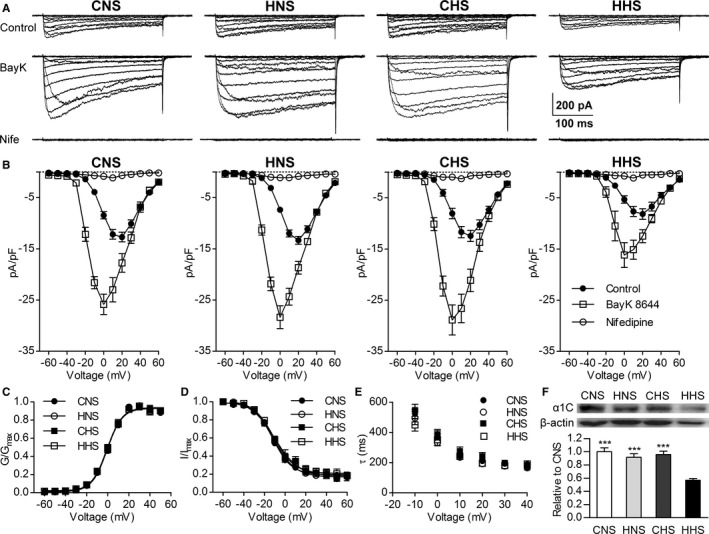
Whole‐cell L‐type voltage‐gated Ca2+ channel (Cav1.2) currents recorded in the myocytes of mesenteric arteries from the CNS, HNS, CHS, and HHS groups. A, Representative traces of Ca2+ channel currents evoked by command potentials (−60 to +60 mV in a 10‐mV step) in the absence (upper, control) or presence of Bay K8644 (center, BayK; 5 μmol/L) or nifedipine (lower, Nife; 1 μmol/L), 20 mmol/L Ba2+ as current carrier. B, Mean current density–voltage relationships of the Cav1.2 currents in the myocytes of the mesenteric arteries from the CNS, HNS, CHS, and HHS groups. Steady‐state voltage‐dependent activation (C) and inactivation (D) curves of the Ba2+ currents in mesenteric myocytes from the CNS, HNS, CHS, and HHS groups. E, The rate of Cav1.2 current inactivation (τ) was similar in CNS (n=24 cells from 10 animals), HNS (n=21 cells from 11 animals), CHS (n=16 cells from 7 animals), and HHS (n=12 cells from 7 animals) cells. F, Western blots of Cav1.2 channel (α1C) subunit (190 kDa) proteins in CNS, HNS, CHS, and HHS mesenteric arteries (n=6 animals per group). The bar plot shows the relative amount of α1C subunit protein in 4 groups. ***P<0.001 vs HHS. CHS indicates control offspring receiving a high‐salt diet; CNS, control offspring receiving a normal‐salt diet; HHS, hypoxia offspring receiving a high‐salt diet; HNS, hypoxia offspring receiving a normal‐salt diet; pA/pF, picoampere per picofarad; G/Gmax, the relative conductance; I/Imax, the normalized peak current.