
Figure 3.
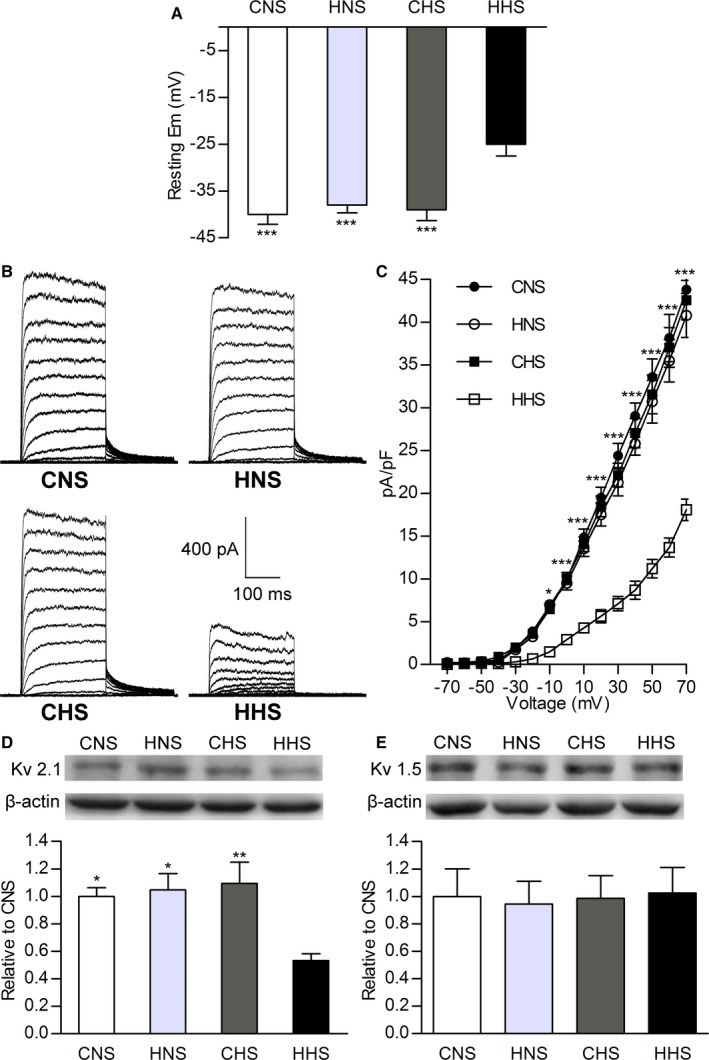
Resting membrane potential (Em) and whole‐cell KV channel current (IK v) recorded using conventional patch methods in mesenteric artery smooth muscle cells. A, Bar plots summarizing mean value of resting Em in CNS, HNS, CHS, and HHS cells. B, Representative IK v from CNS, HNS, CHS, and HHS cells. C, Current–voltage relationships of IK v in CNS, HNS, CHS, and HHS cells. Western blots of (D) KV2.1 (108 kDa) and (E) KV1.5 (76 kDa) channel proteins in CNS, HNS, CHS, and HHS mesenteric arteries. The bar plot shows the relative amount of KV channel protein in 4 groups (6 animals per group). *P<0.05, **P<0.01, and ***P<0.001 vs HHS. CHS indicates control offspring receiving a high‐salt diet; CNS, control offspring receiving a normal‐salt diet; HHS, hypoxia offspring receiving a high‐salt diet; HNS, hypoxia offspring receiving a normal‐salt diet; KV, voltage‐gated K+; pA/pF, picoampere per picofarad.