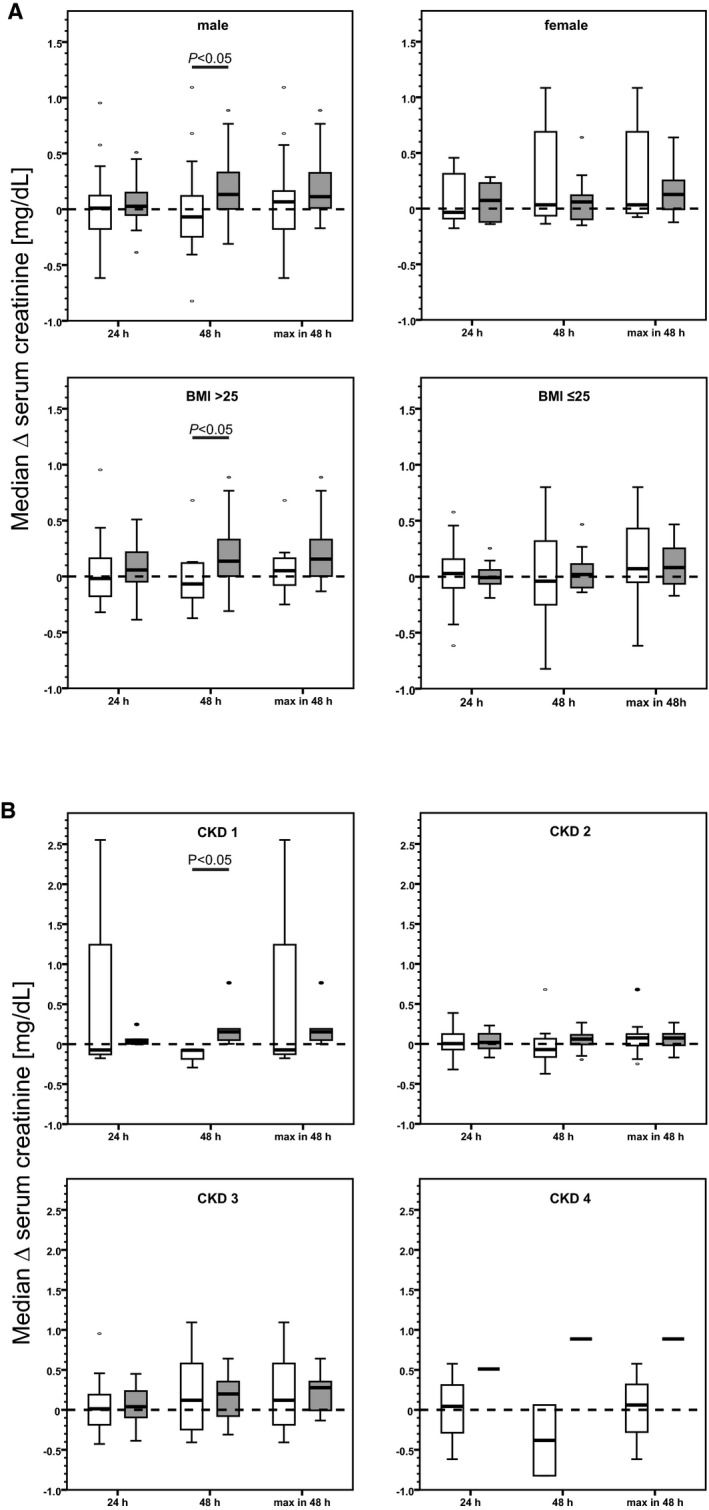
Figure 3.

Subgroup analyses showing impact of sex (A, upper panel), body mass index (BMI; A, lower panel) and chronic kidney disease (CKD) stages (B). A, Male participants: calorie reduction (CR) group (white boxes), 29 of 36 participants; control group (gray boxes), 31 of 40 participants. BMI >25: CR group, 22 of 36 participants; control group, 30 of 40 participants. B, CKD 1: CR group (white boxes), n=3; control group (gray boxes), n=5. CKD 2: CR group, n=15; control group, n=13. CKD 3: CR group, n=13; control group, n=20. CKD 4: CR group, n=2; control group, n=1. Box plots showing the change of serum creatinine from baseline to specified time points.
