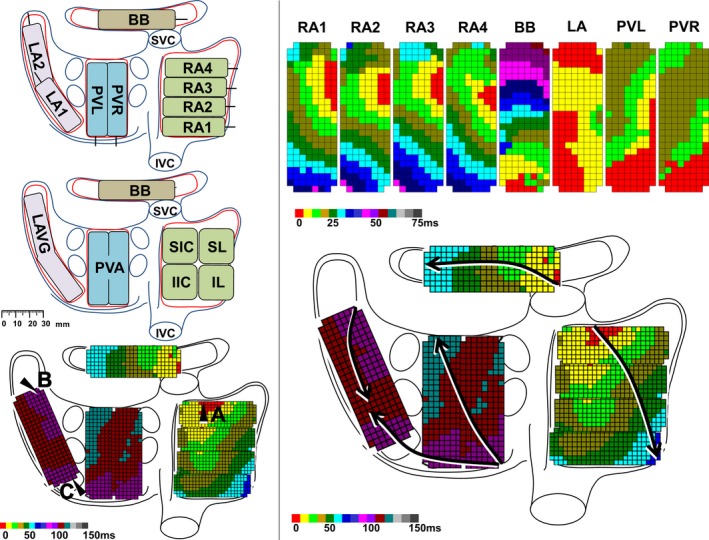
Figure 1.

Activation mapping of the right and left atrium. Left panel: Posterior view of the atria with epicardial mapping scheme (192 electrodes) (upper), classification of the anatomical regions (middle), and landmarks for calculation of duration of wavefront propagation from the origin of sinus rhythm (A) to the LAVG via BB (B) and via PVA (C). Upper right panel: Color‐coded activation maps per mapping site; electrodes activated within the first 5 ms are colored red. Lower right panel: Total activation map constructed relative to local activation times of the reference electrode, which was defined as 0 ms. Arrows indicate main trajectories of SR waves at the different atrial regions. BB indicates Bachmann's bundle; IIC, inferior intercaval; IL, inferolateral; IVC, inferior vena cava; LA, left atrium; LAVG, left atrioventricular groove; PVA, pulmonary vein area; PVL, pulmonary veins left; PVR, pulmonary veins right; RA, right atrium; SIC, superior intercaval; SL, superolateral; SR, sinus rhythm; SVC, superior vena cava.
