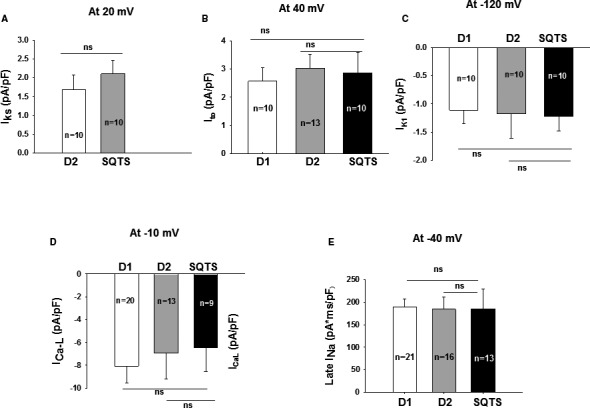
Figure 6.

Changes in ion channel currents in SQTS (short QT syndrome)‐cardiomyocytes. Ion channel currents were recorded in the control‐ (D1, D2) and SQTS‐cells (SQTS). A, Mean values of IK s (slowly activating delayed rectifier potassium channel). B, Mean values of peak Ito (transient outward potassium channel current). C, Mean values of IK 1 (inward rectifier potassium channel current). D, Mean values of peak IC aL (L‐type calcium channel current). E, Mean values of the area under curve of TTX (tetrodotoxin) sensitive late IN a (sodium channel current). Values given are mean±SEM; n, number of cells; ns (not significant), P>0.05.
