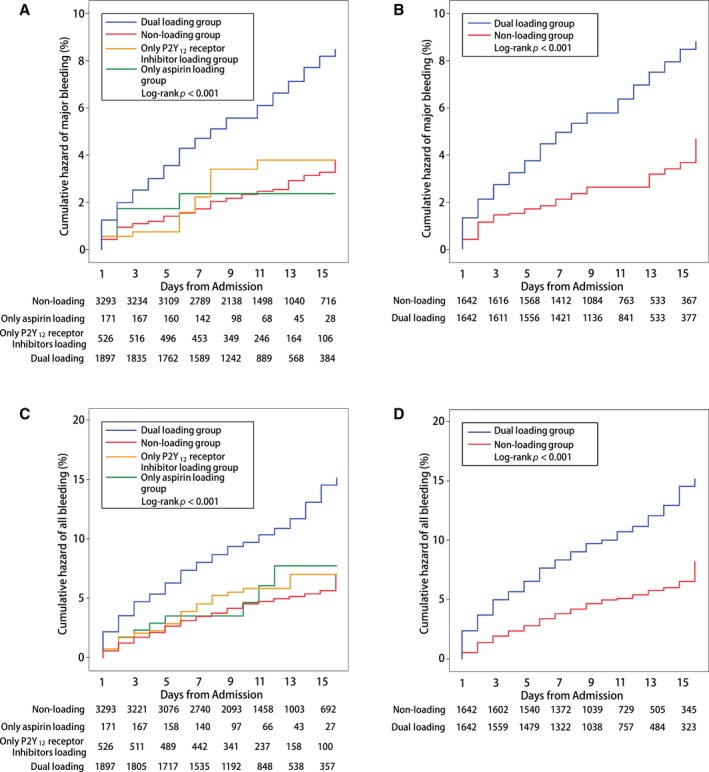
Figure 4.

Cumulative Kaplan–Meier curve estimates of safety outcomes during the 15‐day in‐hospital period. A and B, Data for the primary safety outcomes of major bleeding in the whole study population and the propensity score–matched population, respectively. C and D, Data for the secondary safety outcomes of all‐cause death in the whole study population and the propensity score–matched population, respectively.
