
Figure 3.
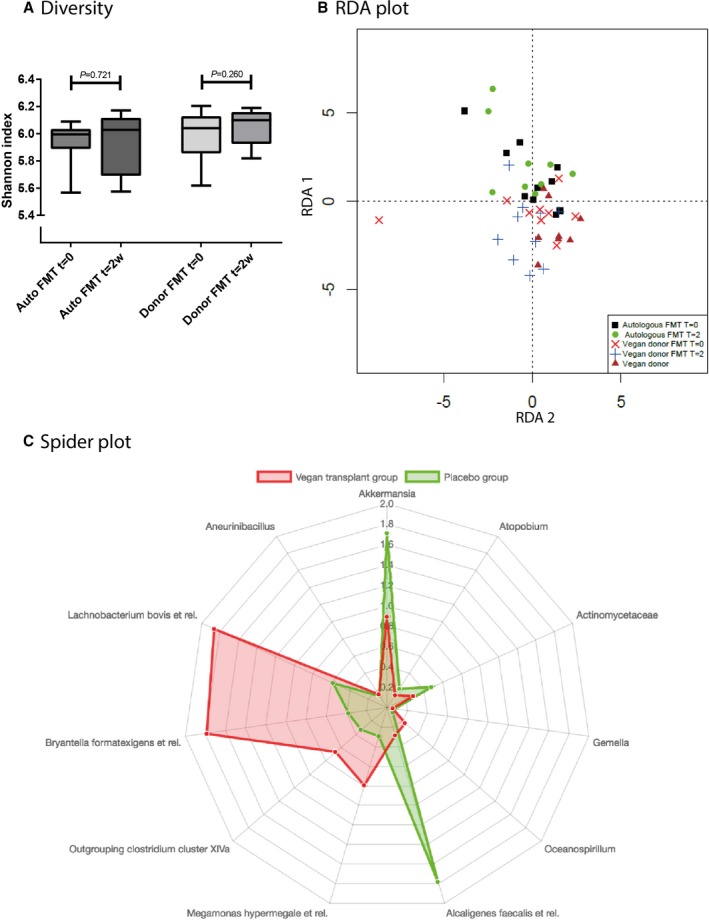
The effect of lean vegan‐donor FMT in fecal microbiota diversity and composition. A, Changes in fecal microbiota diversity 2 weeks after lean vegan‐donor or autologous FMT in obese metabolic syndrome patients, expressed as Shannon index. Data are depicted as box‐and‐whisker plots. P<0.05 was considered significant. B, RDA plot showing the changes in fecal microbiota composition in obese metabolic syndrome patients 2 weeks after either lean vegan‐donor or autologous FMT. C, Spider plot depicting individual fecal microbiota genera that showed different changes in abundance in metabolic syndrome patients after either lean vegan‐donor or autologous FMT. The axis of the spider plot reflects the amount of change (L2 norm) of the bacterial species on autologous (green) or lean vegan‐donor (red) FMT. Auto FMT indicates autologous fecal microbiota transplantation; Donor FMT, lean vegan donor fecal microbiota transplantation; FMT, fecal microbiota transplantation; Placebo, autologous fecal microbiota transplantation; RDA, redundancy analysis; t=0/2w, time point 0/2 weeks.