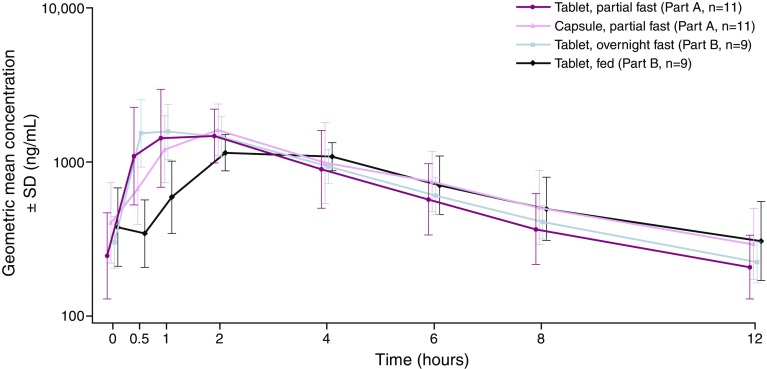
Fig. 1.
Geometric mean (± SD) plasma concentration–time profiles for the AZD5363 tablet and capsule given partially fasted (Part A), and the tablet given after an overnight fast and food (Part B). Summarizes plasma concentrations by nominal sample time, and the symbols have been staggered for clarity of presentation. Geometric mean (± SD) is calculated as exp(µ ± s), where µ and s are the mean and standard deviation of the plasma concentrations on the loge scale

