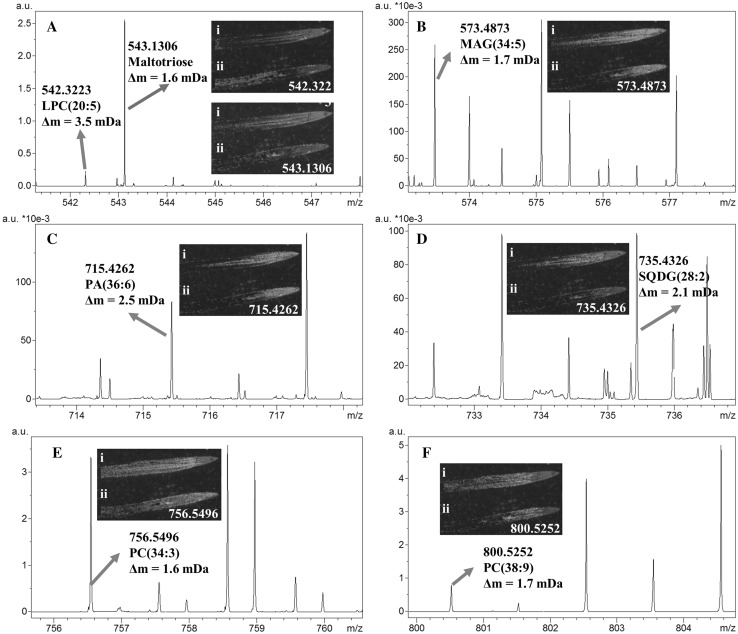
Fig. 1.
Close examination of a MALDI FT–ICR mass spectra imaging shows the peaks and the spatial distribution of tentatively identified metabolites observed in control (i) and salt treated (ii) barley root sections. Δm m/z-value deviation, a.u. arbitrary units. a MS-image of Maltotriose and LPC (20:5); b MS-image of MAG (34:5); c MS-image of PA (36:6); d MS-image of SQDG (28:2); e MS-image of PC (34:3) and f MS-image of PC (38:9)

