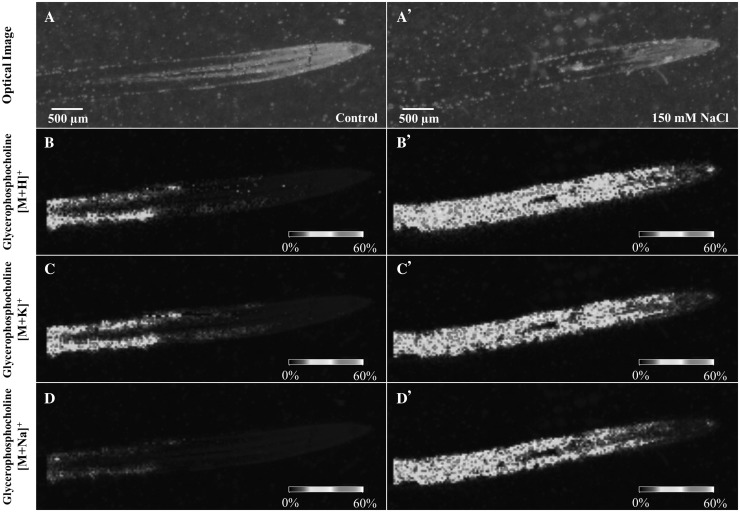
Fig. 3.
Reconstructed ion images of Glycerophosphocholine (GPC) adducts found via MALDI–MSI on barley root sections under control (left panels) and 150 mM NaCl (right panels) conditions. Images were recorded with a scanning step size of 30 × 30 μm. The MS images are of GPC—[M + H]+ (m/z 258.1117), GPC—[M + K]+ (m/z 296.0678), and GPC—[M + Na]+ (m/z 280.0928). Scale bars: 500 μm. Control and salt treated images have been set to the same intensity scale and obtained from the same MALDI–MSI experiment

