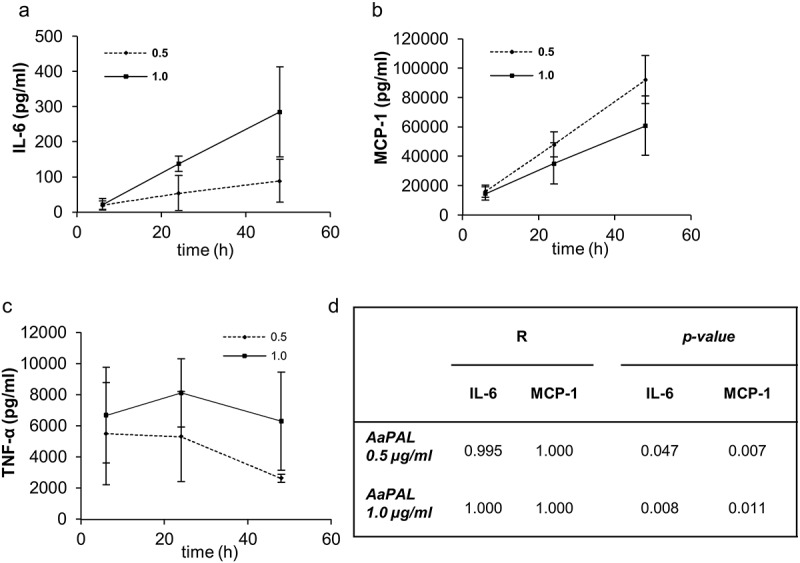
Figure 3.

Kinetics of AaPAL induced (a) IL-6, (b) MCP-1, and (c) TNF-α production from the mouse macrophage cell line RAW 264.7. The measured cytokine concentrations as related to the metabolic activity of the cells (Figure 2) were plotted versus time. The graphs show means and SD from three separate experiments as related to metabolic activities. (d) The linear regression analysis and p-value for R were calculated for the time dependency of IL-6 and MCP-1 production.
