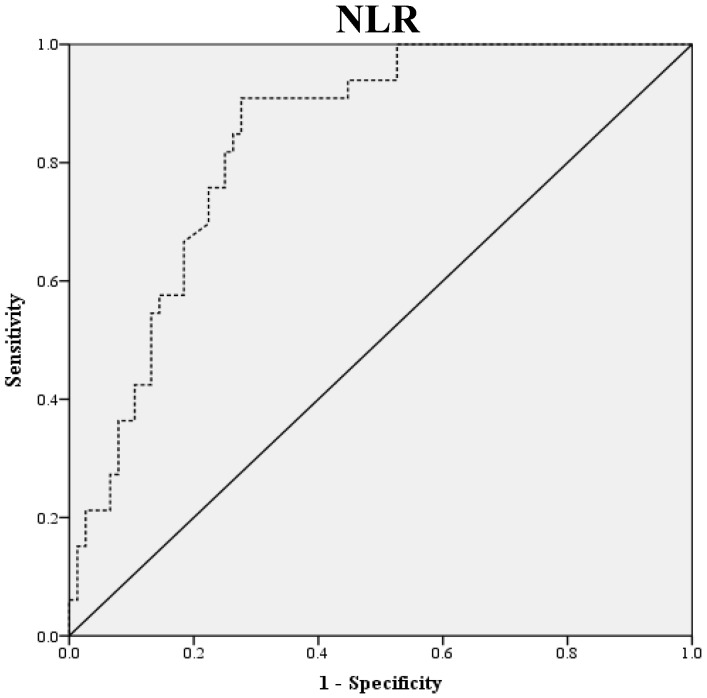
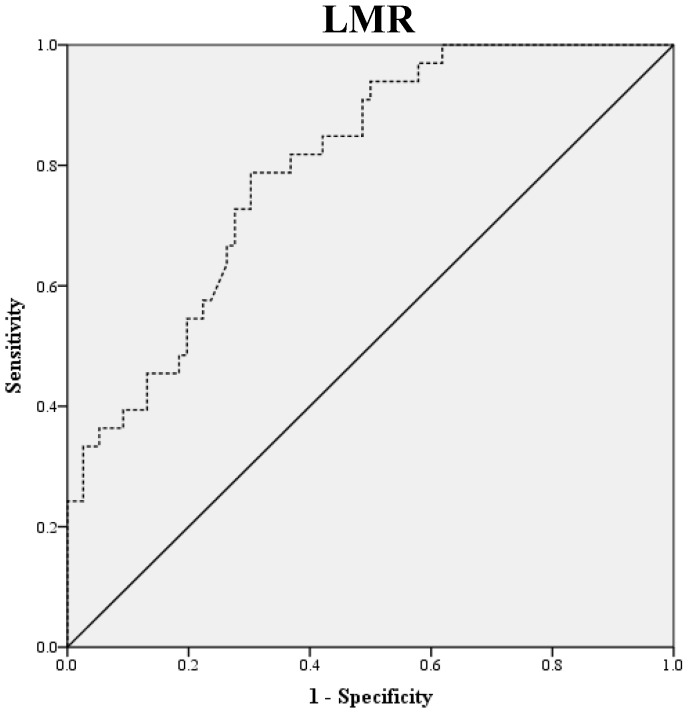
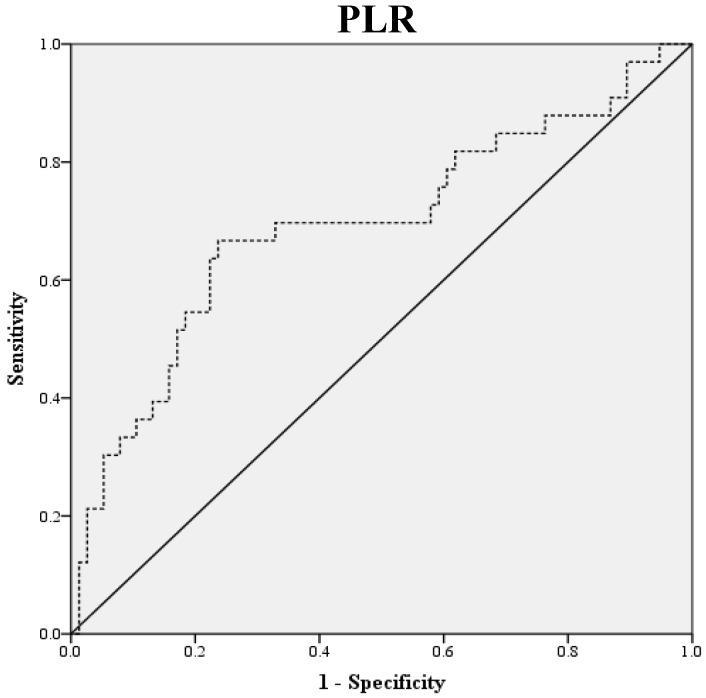
Figure 1.
ROC Curve Analysis for NLR, LMR, and PLR in prediction of 109 patients with ovarian clear cell carcinoma. The area under the curve for the NLR, LMR, and PLR were 0.838 (95% confidence interval [CI], 0.764 to 0.911; P< 0.0001), 0.798 (95% confidence interval [CI], 0.714 to 0.882; P< 0.0001) and 0.693 (95% confidence interval [CI], 0.576 to 0.810; P=0.011), respectively.


