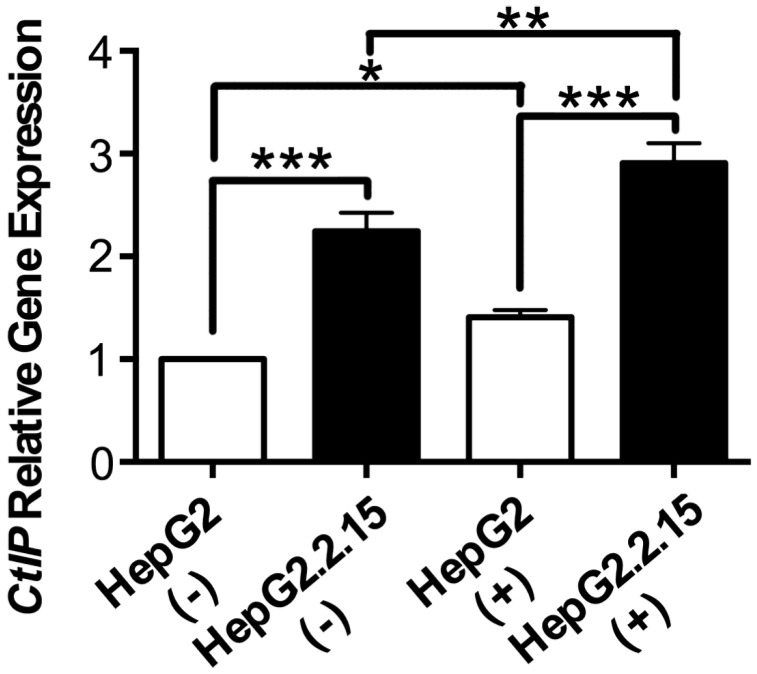
Figure 2.
The effect of HBV on CtIP gene expression of hepatoma cells in DSB. HepG2 and HepG2.2.15 were treated with 3 μg/ml bleomycin at 24 hours. (+) represents bleomycin treatment, whereas (-) represents no bleomycin treatment. CtIP gene expression was examined by real-time PCR. Results are expressed as means ± SEM from six independent experiments. *P<0.05, **P<0.01 and ***P<0.001, one-way ANOVA with S-N-K posttest.

