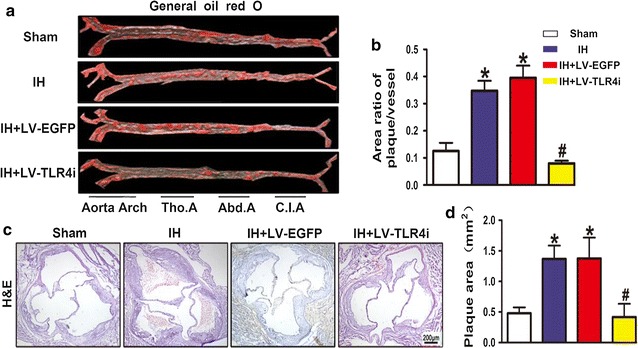
Fig. 2.

Atherosclerotic plaque growth in ApoE−/− mice. a, b General oil red O-stained aortas and the area ratio of plaques of four groups. c, d H&E stained sections of aortic root and the quantification of cross-sectional areas of plaque area in aortic roots. Data represents mean ± SEM of four separate samples.*p < 0.05 versus Sham group and #p < 0.05 versus IH + LV-EGFP group. Tho.A thoracic artery, Abd.A abdominal artery, C.I.A common iliac artery
