
Fig. 3.
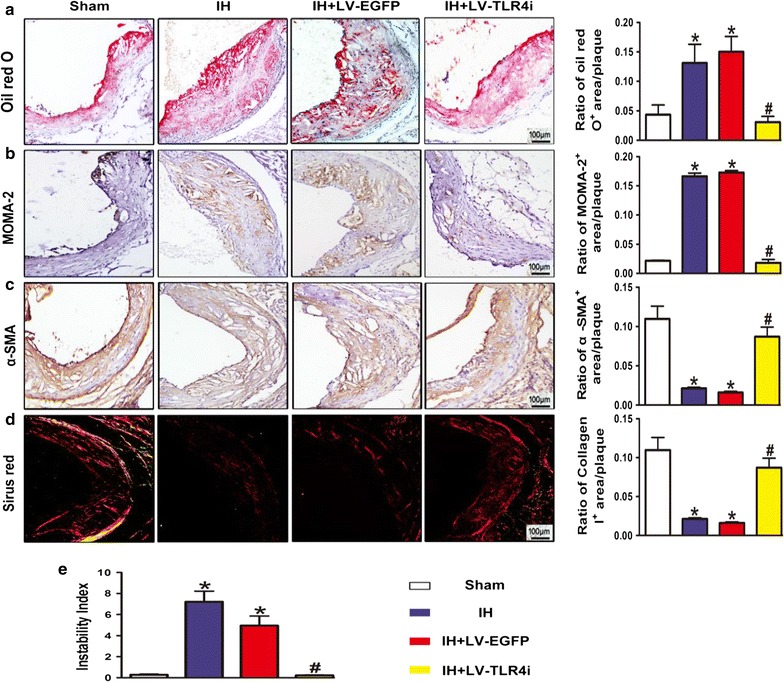
Instability of atherosclerotic plaque. a OilRed O staining image and quantification of lipid deposition. b Quantification of plaque macrophage content by immunohistochemical MOMA-2 staining. c Quantification of plaque smooth muscle cell content by immunohistochemical α-SMA staining. d Picrosirius Red staining image and quantification of plaque collagen I content. e Plaque vulnerability index [(Oil Red O + area plus MOMA-2 + area)/(α-SMA + area plus collagen I+ area)] in atherosclerotic plaque. Data represent mean ± SEM of four separate samples.*p < 0.05 versus Sham group and #p < 0.05 versus IH + LV-EGFP group