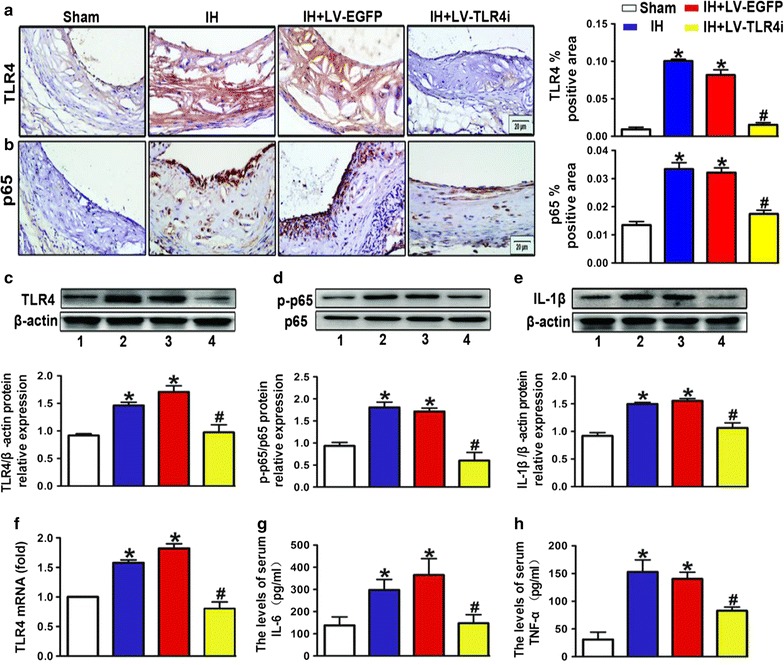
Fig. 4.

Inflammatory response via TLR4-mediated signaling in ApoE−/− mice. a, b Quantification of immunohistochemical staining for TLR4 and p65 in atherosclerotic lesions. Negative controls replaced primary antibody with non-immune IgG (Abcam). c–e Western blot images and quantification of TLR4, p65 and IL-1β expression. f RT-PCR analysis of mRNA expression of TLR4 in the vessels. g, h IL-6 and TNF-α levels determined by ELISA. All quantitative data are mean ± SEM of three separate samples. Bar 1: Sham; bar 2: IH; bar 3: IH + LV-EGFP; bar 4: IH + LV-TLR4i; *p < 0.05 versus Sham group and #p < 0.05 versus IH + LV-EGFP group
