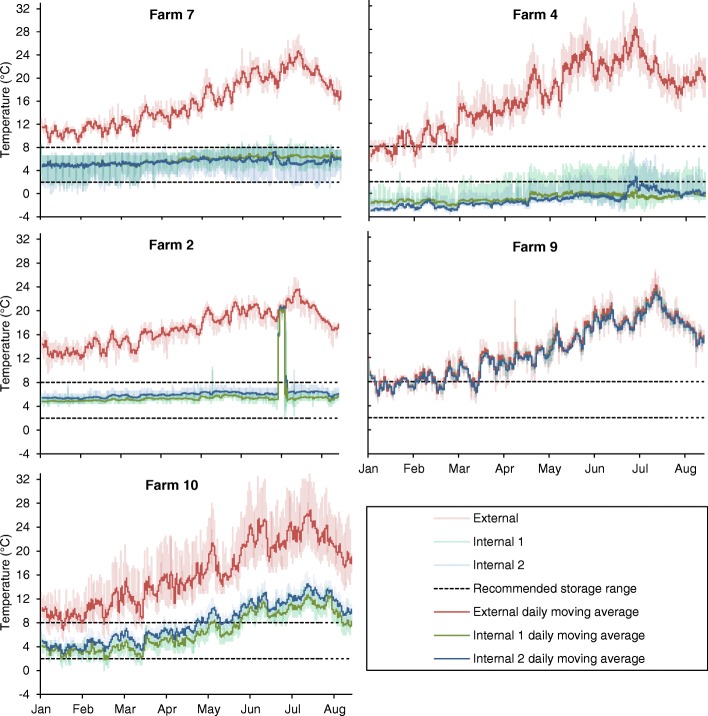
Fig. 3.
Temperature recordings from five selected farms. Shaded areas represent individual recordings whereas the solid-line represents a daily moving average. External is the data logger placed outside of the fridge, Internal 1 the data logger placed on the uppermost shelf in the fridge and Internal 2 the lowermost. Squared dot line represents the recommended storage temperature range of 2 to 8 °C

