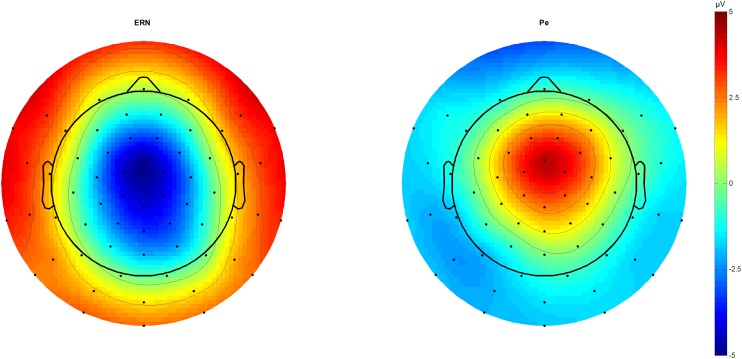
FIGURE 1.
ERN and Pe topographic plots. Topographic plots of the amplitude difference between correct and incorrect outcomes at 46 (ERN) and 212 ms (Pe) post-response. Scaling from –5 to 5 μV. Voltage maximum is at fronto-central midline sites that were used for further component analysis as a region of interest average. ERN, error-related negativity; Pe, error positivity.

