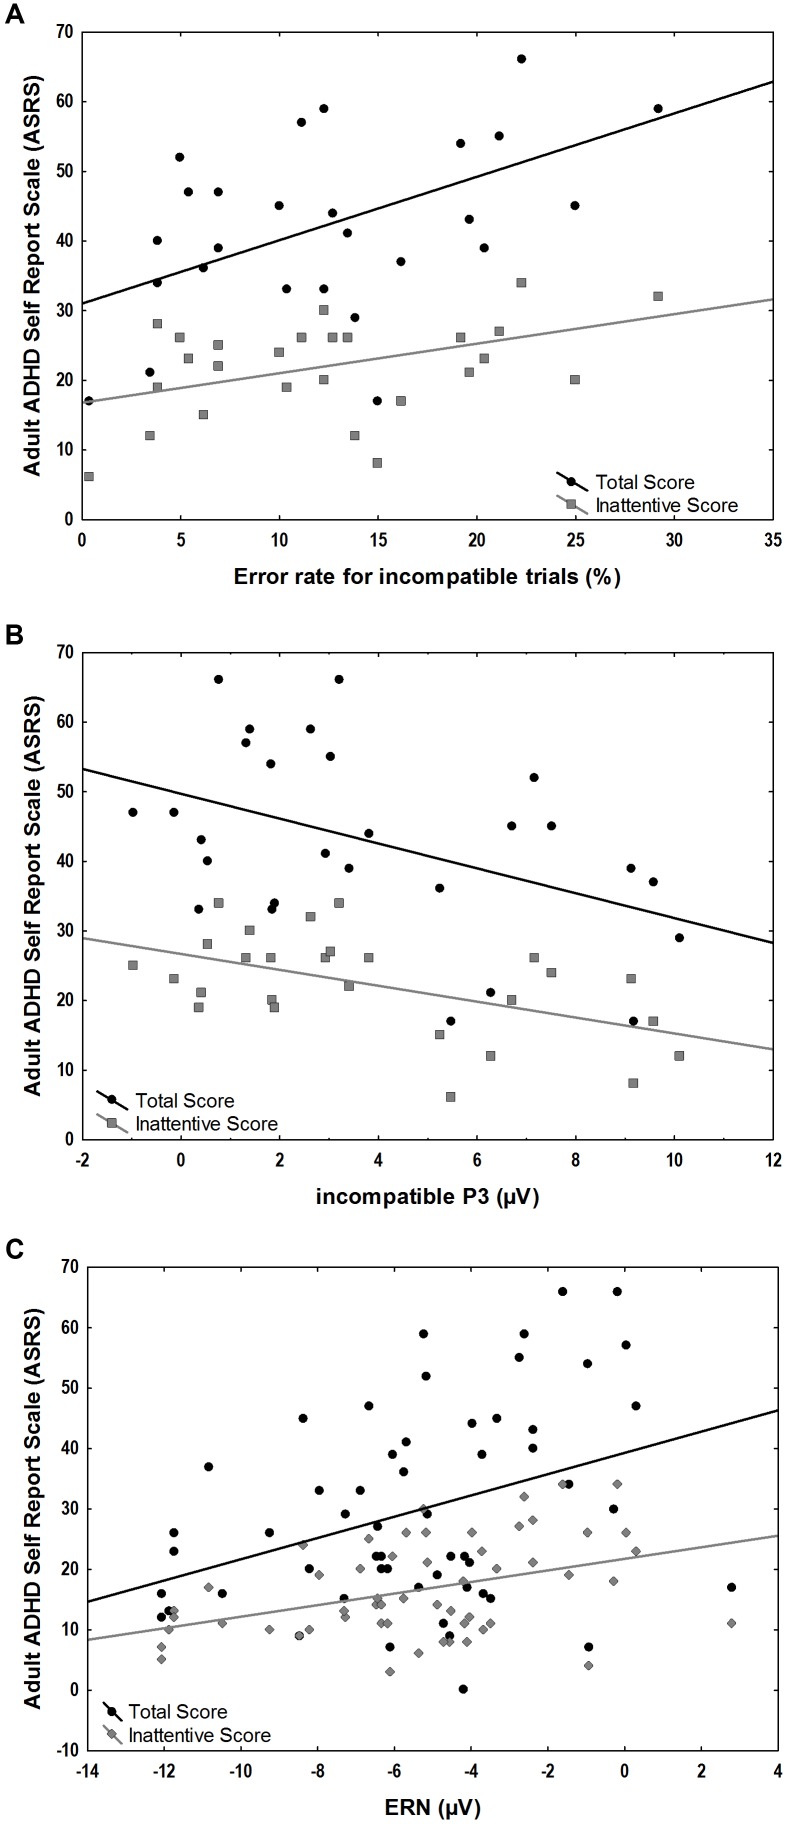
FIGURE 5.
Associations between ASRS scores and ERP amplitudes and behavioral measures in the ADHD group. (A) Positive correlations of error-rates for incompatible trials and total (r = 0.52, p = 0.006) and inattentive ASRS scores (r = 0.44, p = 0.02). (B) Negative correlation of incompatible P3 correlated with total (r = –0.44, p = 0.02) and inattentive ASRS scores (r = –0.52, p = 0.005). (C) Positive correlation of ERN and total (r = 0.44, p = 0.02) and inattentive ASRS scores (r = 0.40, p = 0.04).

