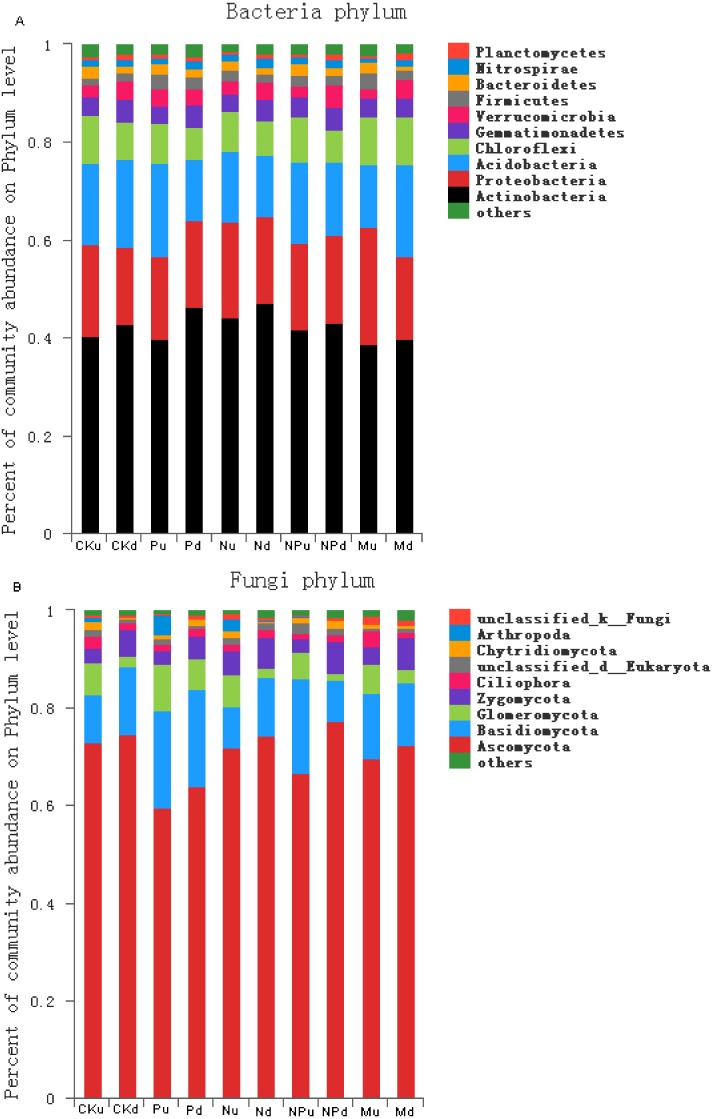
Figure 3. Proportions of the bacterial phyla (A) and fungal phyla (B) with the relative abundance higher than 1%.
CK, Control; P, 60 kg P ha−1; N, 100 kg N ha−1; NP, 60 kg P ha−1 plus 100 kg N ha−1; M, 4,000 kg sheep manure ha−1. Lowercase letter “u” after treatment represented samples from 0–10 cm soil layer; “d” represented samples from 10–20 cm soil layer.

