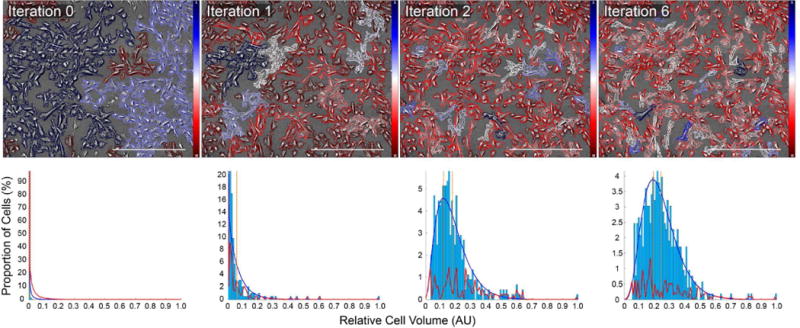
Fig. 4.

Iterative segmentation results for CD31/CD34 double negative iPSCs. Top row, left to right: Segmentation results after 0, 1, 2, and 6 rounds of iterative segmentation. Cell boundaries are overlaid with a diverging red-blue colormap indicating each cell’s volume relative to all those observed in the current FOV. Bottom row, left to right: Corresponding distribution of volumetric data. With each round of segmentation, the distribution of cell volume data moves away from an exponential-like distribution and toward a Gamma-like one. Per-bin fitting error between histogram data and fitted Gamma curve plotted in red. Each image represents a 3×3 montage of the same FOV. Scale bars represent 500 μm. Color bars in top row indicate relative optical cell volume from the minimum (red) to the maximum (blue).
