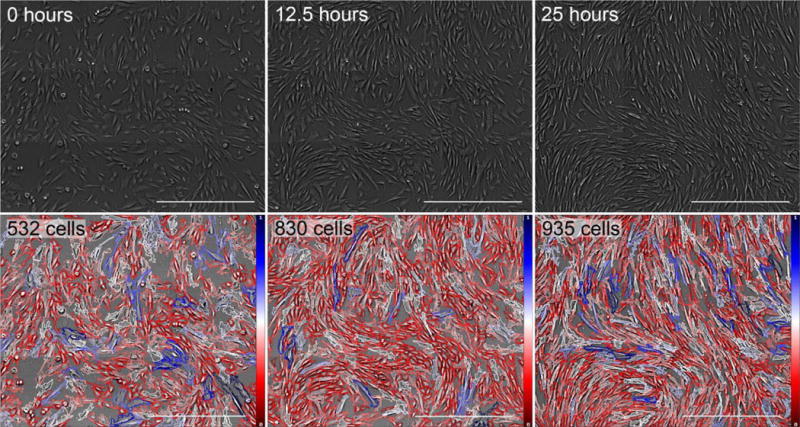
Fig. 6.

Segmentation results for time-lapse imaging of Huf3 FBs sampled at three different time points. From left to right: images taken at 0, 12.5, and 25 hours (shown left to right). During this time, the total number of cells within our FOV nearly doubles, increasing from 500 cells to just fewer than 1,000 cells. Each image represents a 3×3 montage of the same FOV. Scale bars represent 500 μm. Color bars in bottom row indicate relative optical cell volume from the minimum (red) to the maximum (blue).
