
Fig. 9.
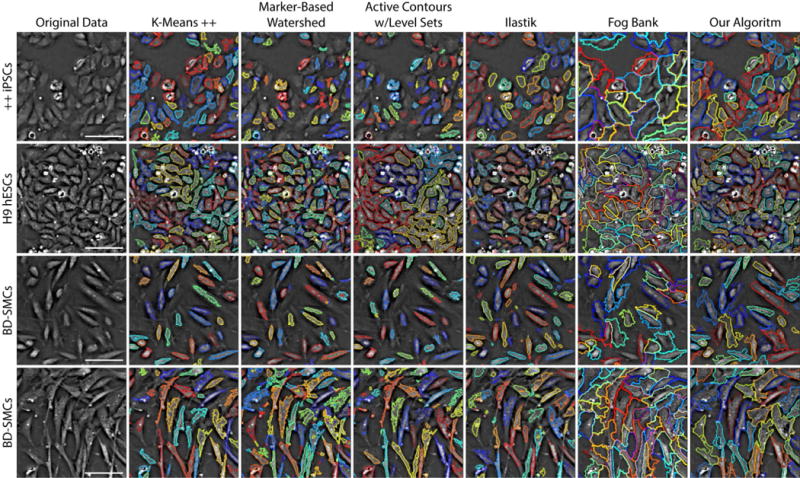
Qualitative comparison of segmentation techniques on QPM data. Different cell lines are presented row-wise, from top to bottom: (1) double positive CD31/CD34 iPSCs, (2) H9 hESCs, and (3 and 4) BD-SMCs from different experiments and time-points. Different segmentation techniques are shown column-wise, from left to right: (a) original data, (b) k-means++, (c) marker-based watershed, (d) active contours with level sets, (e) Ilastik, (f) FogBank, and (g) our iterative algorithm. Although none of these approaches were designed for use with QPM, most show strong potential for utility. Outlines are shown with random color assignments to help visualize boundary separation. Each FOV is 145 × 145 μm. Scale bars represent 50 μm.