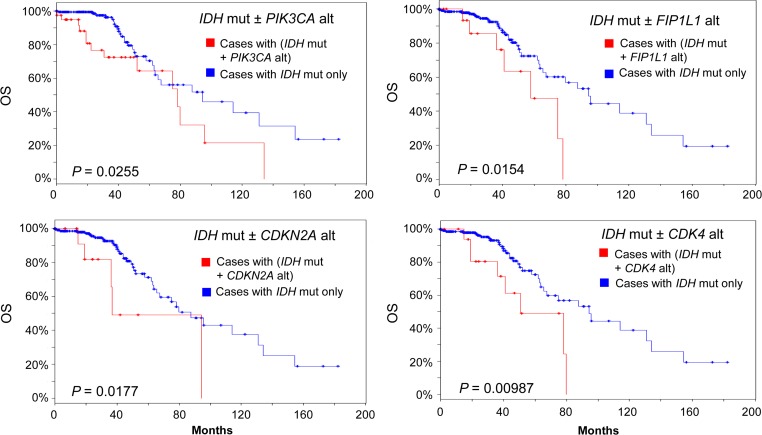
Figure 5.
OS within the IDH-mutated LGG group. Sample size n = 231. Blue line: patients with IDH mutation only (IDH mut−, n = 183, 211, 219, 211 clockwise). Red line: patients with IDH mut plus other gene alteration (IDH mut+). Mut, mutated. Alt, alteration. Alterations of PIK3CA (n = 46), FIP1L1 (n = 18), CDKN2A (n = 10), or CDK4 (n = 18) decreased OS in patients with IDH mut. P-value is from Logrank test.

