. 2018 Apr 3;113(5):e170404. doi: 10.1590/0074-02760170404

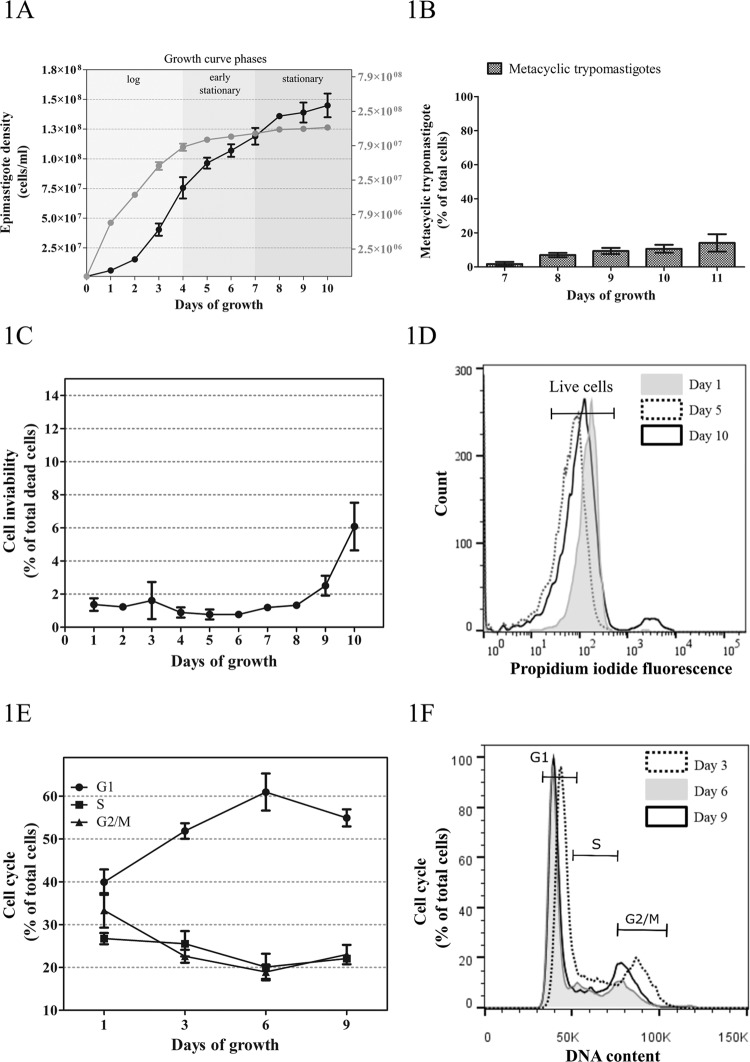
Fig. 1. : analysis of axenic epimastigote growth. (A) Parasitic growth in culture was measured daily over a 10-day period and cell densities were plotted against time showing the growth curve. Left y-axis, linear scale; right y-axis, logarithmic scale. (B) Percentage of metacyclic trypomastigotes during epimastigote culture. (C) Cell viability was measured daily by propidium iodide (PI) staining over a 10-day period and plotted against time. (D) Cell viability profiles of epimastigote cells with PI fluorescence (indicating live vs. dead cells) at day 1, 5, and 10. (E) Cell cycle distribution was assessed at day 1, 3, 6, and 9 of epimastigote growth and plotted against time. (F) Flow cytometry profiles of epimastigote cells with PI fluorescence (indicating DNA content) at day 3, 6, and 9. Values are expressed as the mean ± SD of three biological replicates.

Fig. 1