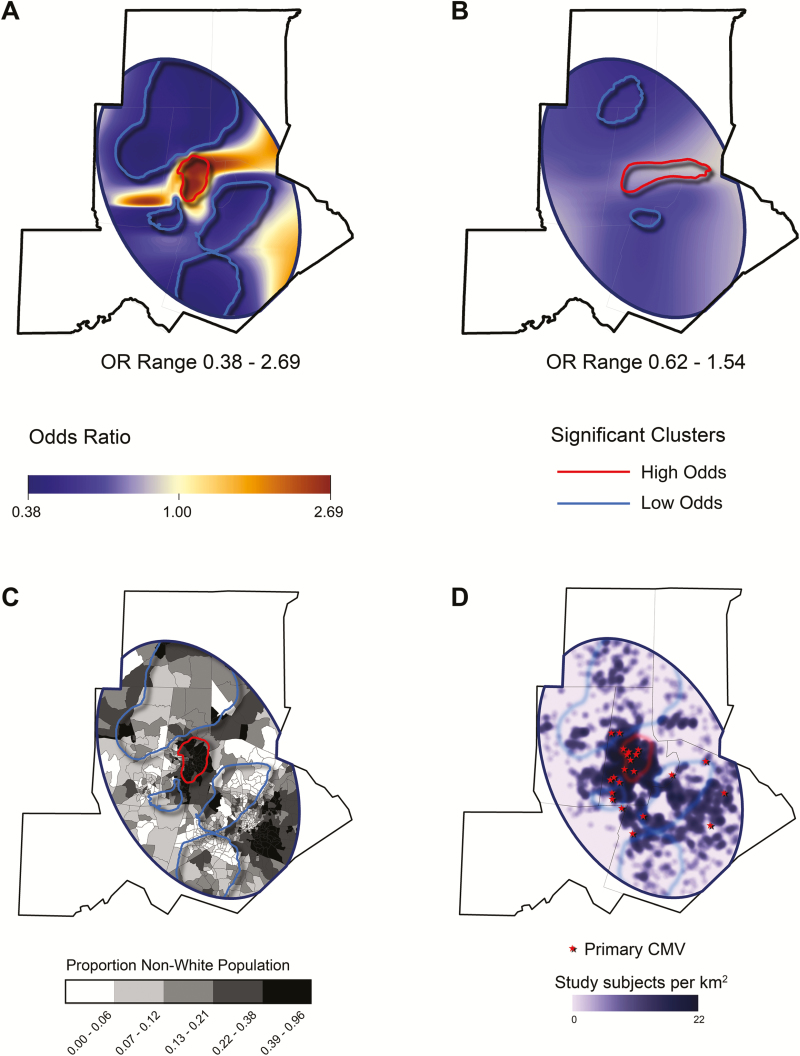
Figure 3.
Generalized additive model (GAM) showing geographic variation and clustering of cytomegalovirus (CMV) seropositivity. This analysis was similar to logistic regression, but in the GAM, the response variable was correlated with a 2-dimensional spatial smoothing function, which results in a continuous odds ratio (OR) surface. The response variable in this model was the binary result of CMV testing (CMV seropositive vs uninfected). Areas with significantly high or low odds of CMV are circled with a contour, which represents a 2-tailed P value of .05. (A) Unadjusted GAM. Our unadjusted model identified a cluster with significantly high odds of CMV seropositivity overlying the city of Durham; several large clusters with significantly low odds of CMV seropositivity were found also. (B) Adjusted GAM. Adjusting for subject race and age diminished the OR range, but clustering was still observed in a similar distribution, which suggests that the heterogeneous distribution of CMV cannot be explained solely by racial segregation. (C) Odds clusters generated by our unadjusted GAM superimposed on a census tract map. Census tracts are shaded according to the proportion of the population that is nonwhite. The high-odds cluster circumscribed the high minority urban tracts in Durham, whereas the low-odds clusters encircled areas with lower minority populations. (D) Geographic distribution of cases of primary CMV infection. The approximate location of the subjects with primary CMV infection, as defined by low anti-CMV IgG avidity, are displayed. Most of the 23 women with primary CMV infection lived in the densely sampled areas of Durham County. To preserve anonymity, only approximate subject locations are shown.

