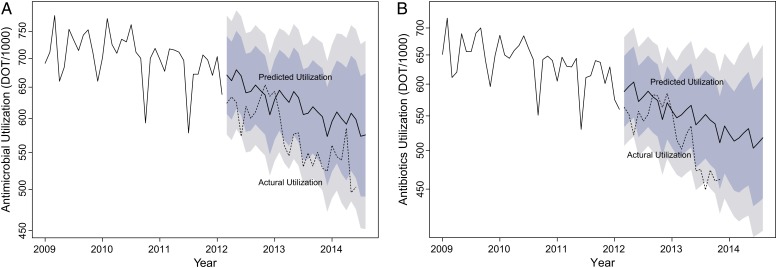
Figure 1.
Parenteral antimicrobial (A) and antibiotic (B) use at Monroe Carell Jr. Children's Hospital at Vanderbilt. The line marked “Predicted Utilization” represents predicted use based on autoregressive integrated moving average models; the light and dark shaded areas represent 80% and 95% confidence intervals, respectively, for the prediction adjusted for periodicity, seasonal trends, and the overall decreasing trend. The line marked “Actual Utilization” represents actual (observed) use. The y-axis is log-transformed. Abbreviation: DOT/1000, days of therapy per 1000 patient-days.

