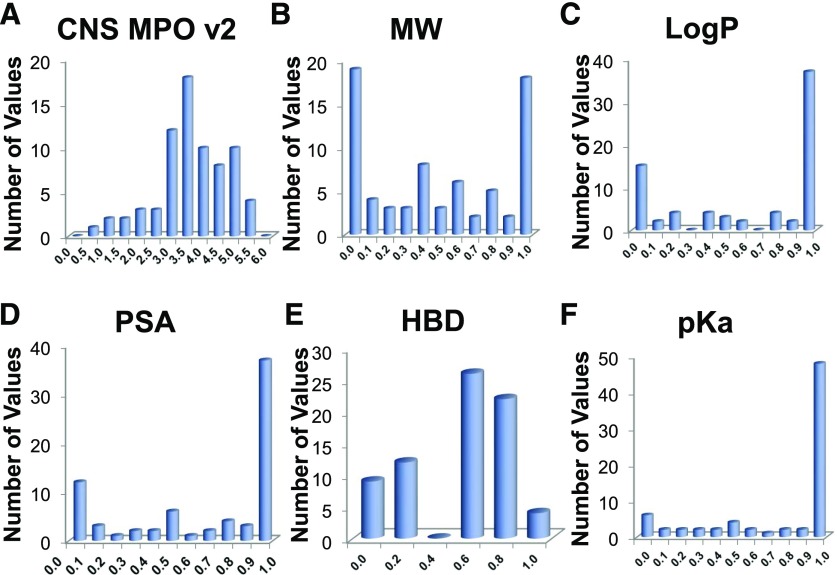
Fig. 9.
CNS MPO Version 2 scores were calculated for 73 of the GBM drug candidates listed in Table 1. Plots are shown for scores calculated for total CNS MPO score (A), molecular weight distribution (B), LogP value distribution (C), polar surface area value distribution (D), hydrogen bond donor total distribution (E), and pKa value (of the most basic center) distribution (F).

