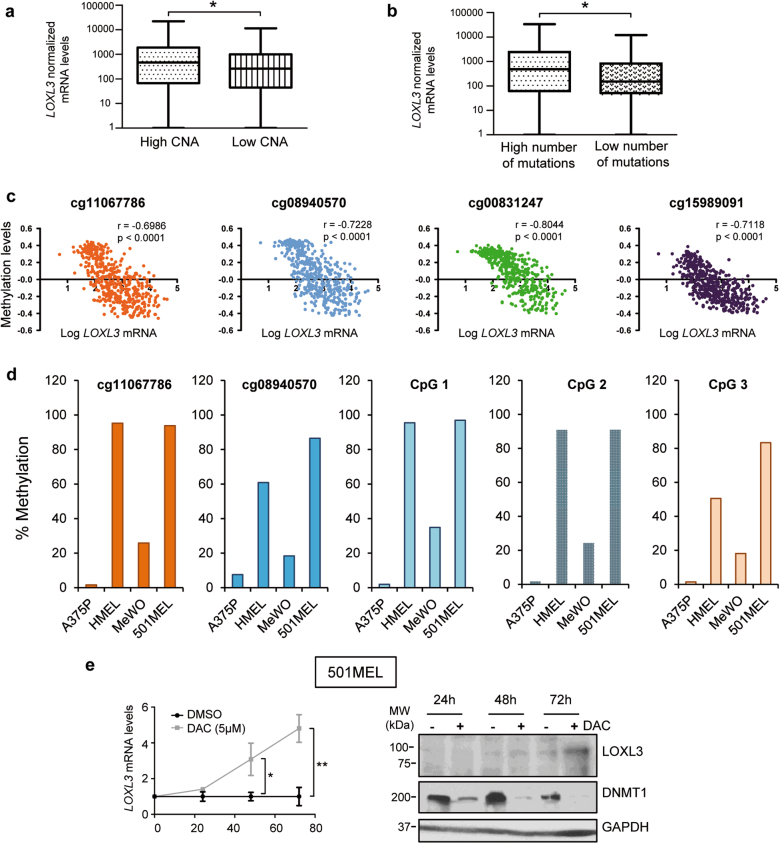
Fig. 7. LOXL3 sustains genome stability.
(a and, b) ma samples analyzed by The Cancer Genome Atlas (TCGA) [24] were classified by CNA (copy number alterations, score) (a) (n = 351 patients) and total number of mutations (b) (n = 316 patients) and plotted against LOXL3 normalized mRNA levels (first vs. fourth quartile). Error bars represent s.e.m. ∗p < 0.05 by a two-tailed Student’s t-test. (c) LOXL3 methylation levels compared to LOXL3 mRNA expression levels in tumors from the TCGA [24] melanoma data set (n = 473) corresponding to CpG loci with indicated probes from TCGA [24] within regulatory regions of human LOXL3 gene. p-value was calculated by two-tailed Spearman correlation. (d) Percentage of LOXL3 methylation in the indicated melanoma cell lines (A375P, HMEL, MeWo, and 501MEL) within the CpG loci corresponding to two probes depicted in c and three additional probes designed for CpG loci located within intron 1 of human LOXL3 gene (CpG 1–3) (see Supplementary Fig. 7). (e) 501MEL cells were treated with vehicle (DMSO) or 5 µM decitabine (DAC) and LOXL3 mRNA (left panel) or LOXL3 protein levels (right panel) were analyzed at the indicated time points, n = 3 biologically independent replicates. Left, error bars represent s.e.m. ∗∗p < 0.01 by a two-sided Student’s t-test. Right, results from one representative experiment are shown. DNMT1 was used to confirm methylation inhibition by DAC and GAPDH was used as a loading control

