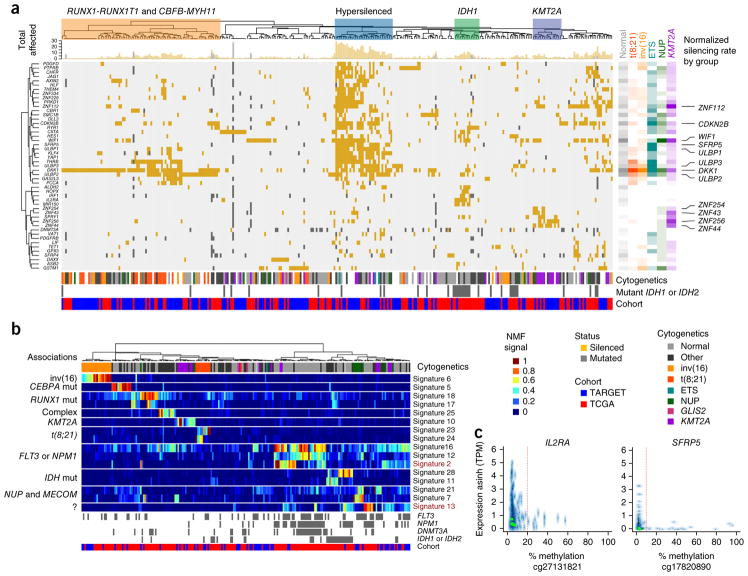
Figure 5.
Aberrant DNA methylation in adult and pediatric AML. (a) Integrative analysis of genes with recurrent mutations, deletions or transcriptional silencing by promoter DNA hypermethylation (rows) in TARGET and TCGA AML cases (columns). Cluster associations are labeled at the top, including a prominent group enriched for younger subjects with WT1 mutations (P = 0.0012) that shows extensive transcriptional silencing across dozens of genes (blue boxed region). The cytogenetic group, IDH1 or IDH2 mutation status (gray, mutated; white, wild type or unknown) and TARGET or TCGA cohort membership (blue and red, respectively) for each sample are indicated below the main figure. The top marginal histogram indicates the total number of genes impacted for each subject. Right, gene and cytogenetic associations; rate of involvement by cytogenetic class per gene is indicated by color and shading (unfilled, no involvement; full shading, maximum observed involvement of any gene within subjects of the indicated cytogenetic grouping). Wnt regulators and activating NK cell ligands (for example, DKK1 and WIF1; and ULBP1, ULBP2 and ULBP3, respectively) are silenced across cytogenetic subtypes (labeled at far right). Distinct groups of silenced genes are also associated with subjects with mutated IDH1 or IDH2 and with subjects with rearranged KMT2A. A subset of genes (56 of 119) altered in >3 subjects and in subjects (n = 310; 168 TARGET, 142 TCGA) with one or more genes silenced by promoter methylation is illustrated (Supplementary Figs. 21 and 22, and Supplementary Tables 8 and 9, enumeration of all 119 genes in all 456 evaluable subjects.). (b) A subset (16 of 31) of DNA methylation signatures derived by NMF and in silico purification with samples ordered by hierarchical clustering of signatures (labeled at right). Genomic associations are indicated to the left of the main panel. Signature 13 does not correspond directly to any known recurrent alterations; however, it displays potential prognostic relevance, as does signature 2 (Supplementary Fig. 24). The subject-specific score matrix and display of all 31 signatures are provided in Supplementary Table 10 and Supplementary Figure 23. ?, unknown associations. (c) Examples of expression–promoter DNA methylation relationships are shown for IL2RA and SFRP5; these two genes were identified as recurrently silenced (in a) and also contribute to NMF signatures (in b). y axis, transformed expression (asinh(TPM)); x axis, promoter CpG methylation numbers below x-axis, methylation array probe identifiers; TPM, transcripts per million. The vertical red line indicates the empirically established silencing threshold.

