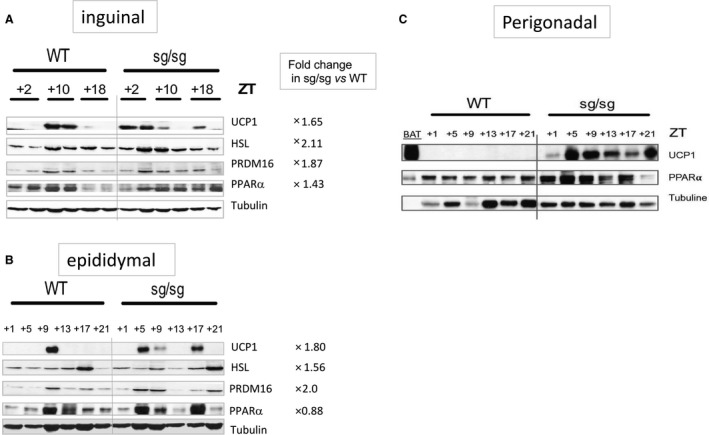
Figure 3.

Circadian pattern of thermogenic protein expression in two WAT depots of sg/sg and WT mice. Western blot analysis of WAT protein lysates over a 24‐h period. Protein extracts from two mice at each indicated point were pooled in B. (A) and (B) concerned IAT and EAT from male mice, respectively, and (C) concerned perigonadal AT from female mice. Fold change referred to the sum of densitometric signals compared to a tubulin loading control over the 24‐h period in each genotype.
