
Figure 5.
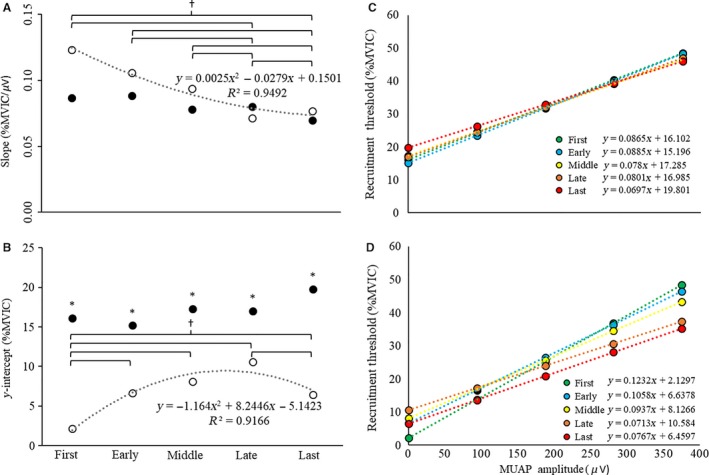
(A–B) The (A) slopes (pps·μV−1) and (B) y‐intercepts (pps) of the recruitment threshold (RT) versus motor unit action potential amplitude (MUAPPP) relationships during the first, early, middle, late, and last repetitions of the high‐torque (solid circles, black dotted line) and low‐torque (open circles, gray dotted line) exercise conditions. (C–D) The average linear regression lines for the RT versus MUAPPP relationship for the first, early, middle, late, and last repetitions during the (C) high‐torque and (D) low‐torque exercise. *indicates a significant main effect for torque (HT > LT); †indicates significant differences between repetitions in the LT condition, only.