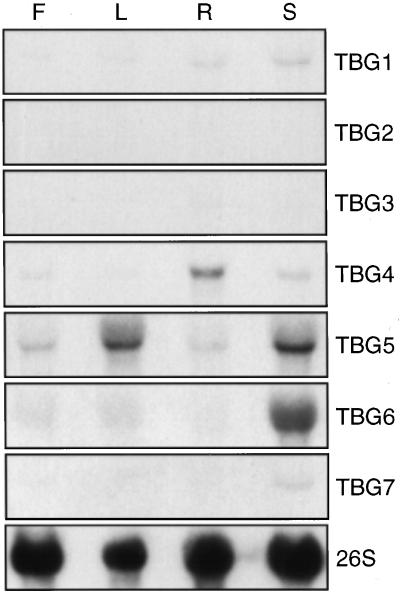
Figure 5.
RNA gel-blot analysis of TBG expression in various plant tissues. Twenty micrograms of total RNA extracted from flowers (F), leaves (L), roots (R), and stems (S) was loaded in each lane. Blots were hybridized using the probes indicated to the right. A 26S ribosomal gene clone from soybean was used as a loading control for each blot; one example is shown.

