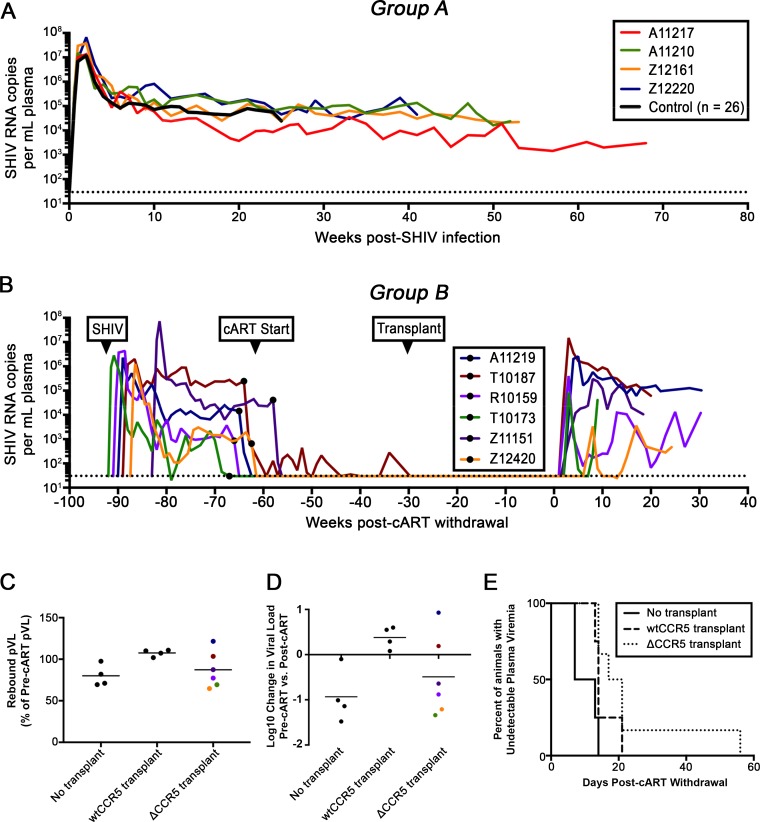
Fig 4. Plasma viral loads in ΔCCR5 animals are comparable to controls.
(A) SHIV plasma viral loads from Group A animals transplanted prior to infection. (B) SHIV plasma viral loads from Group B animals that were transplanted following infection and stable suppression and subsequently released from cART. Black circles indicate cART initiation. (C) Measurements from Group B in panel B (“ΔCCR5 Transplant”) were used to calculate the ratio of rebound viremia to viremia during primary infection, and compared to Group C (“No Transplant”) and Group F (“wtCCR5 Transplant”). (D) Log change in average set point viral load between rebound and primary infection. (E) Days to rebound following cART withdrawal. Colored data points in panels (C-D) correspond to lines in (B). Dotted lines in panels (A-B) indicate limit of detection of the plasma viral load assay (30 copies/mL).

