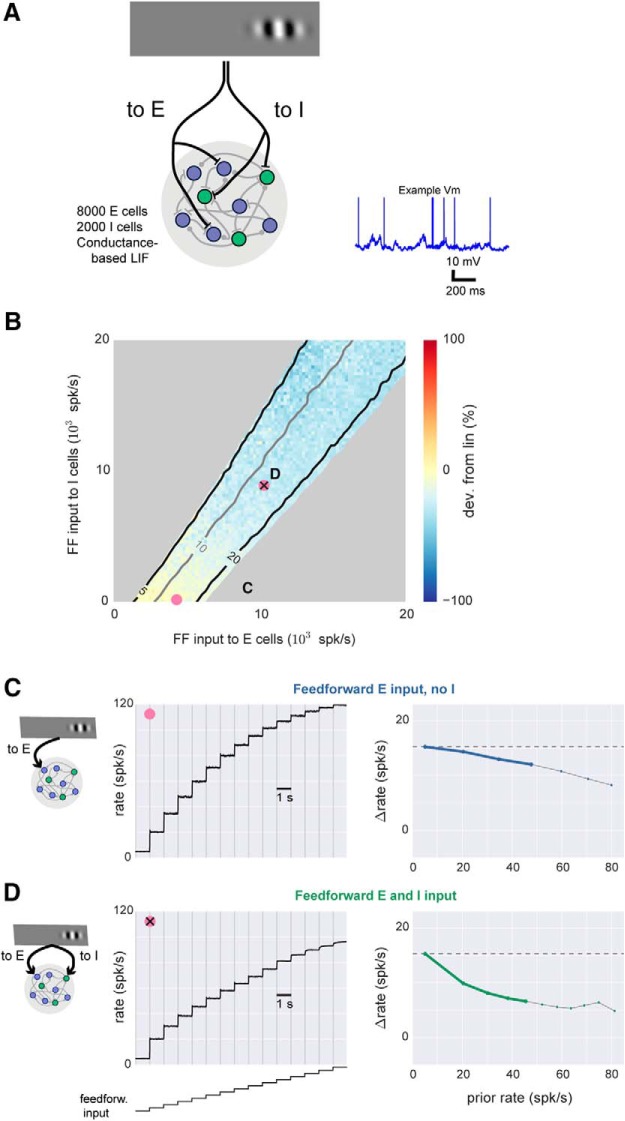
Figure 3.
Spiking model shows sublinear scaling with feedforward inhibition. A, Schematic of network architecture. Blue, E cells; green, I cells. The conductance-based spiking model produces stochastic Vm and spikes as seen in vivo, and an example membrane potential (Vm) trace from one excitatory cell is shown. B, Response scaling as feedforward (FF) input to E and I cells is varied. To measure response scaling, inputs to E and/or I cells with rate given by x and y axes are delivered, and average response over all E cells is measured. Then, the E and I input rates are multiplied by a constant (here, 2), and the size of the second response is compared to the first. Percentage change shown by color: yellow, second response is similar (linear); blue, second response is smaller (sublinear). Contour lines show first response (spk/s). Response rates <5 and >20 spk/s are masked (gray). Average spontaneous rate is adjusted to 5 spk/s (Methods), and 33% of network neurons receive external input, to approximate the sparse set of cortical neurons that typically respond to sensory inputs (Fig. 1). There is a gradual increase in sublinearity moving up and to the right in the figure. Pink points show E and I rate combinations used in C and D. C, Near-linear responses to a range of input sizes when feedforward input is provided to E cells only. Parameters here are indicated by pink dot in B, and first two responses here are the same two responses used to compute percentage change shown in color there. Left, average rates; right, same data replotted showing change (spk/s) in response (y-axis) as a function of prior response (x-axis). For these plots, a linear response is a horizontal line (dashed gray line). Heavy lines, prior rates <50 spk/s, highlighting for visual clarity rates far from potential saturation caused by absolute refractory period (3 ms). D, Sublinear responses to a range of input sizes when input provided to both E and I cells. Same conventions as C. In this case, heavy green line in right panel lies farther below horizontal than heavy blue line in C, showing more sublinear scaling.

