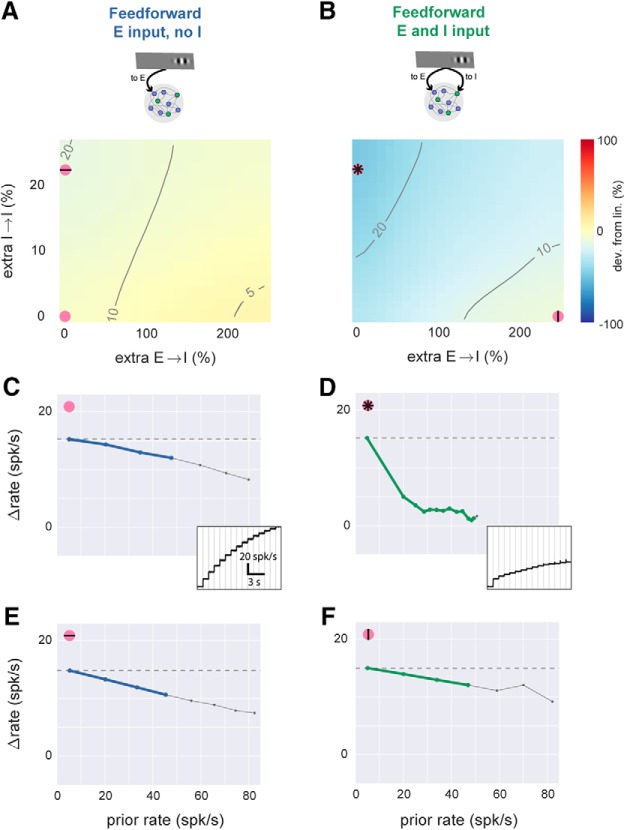
Figure 4.
With feedforward inhibition, network model can produce linear or sublinear responses. A, Simulations with feedforward input to E cells only, while local network connectivity is varied. x-axis, E-to-I connection strength; y-axis, I-to-I connection strength. Axes give percentage change in total synaptic input that a single cell receives from one (E or I) population (see Methods), where zero is a balanced network (e.g. Fig. 3) with equal probability of synapses onto E and I cells. Other conventions as in Fig. 3B (contour lines show evoked response to first stimulus, color shows percentage difference in response to doubled external stimulus). Spontaneous rate and external stimulus rates are constant for entire panel. B, Simulations with feedforward input to E and I cells while local connectivity is varied. Pink symbols show parameter regions where scaling is sublinear (stronger I→I connectivity) or linear (stronger E→I connectivity). C, Scaling plot (response size as a function of previous rate) for parameters shown by pink dot in A: no extra local connections, feedforward E only, same parameters as Fig. 3C. Inset, time course of responses to the step stimulus; subtracting each rate from rate at the previous step gives y-axis in main panel. D–F, same plots, using parameters shown by corresponding pink dots in B. Comparing D and E shows that large sublinearity can be produced by extra I→I connections only with feedforward inhibition. Comparing D and F shows that linearity can also be achieved with feedforward inhibition if E→I connectivity is strengthened.

