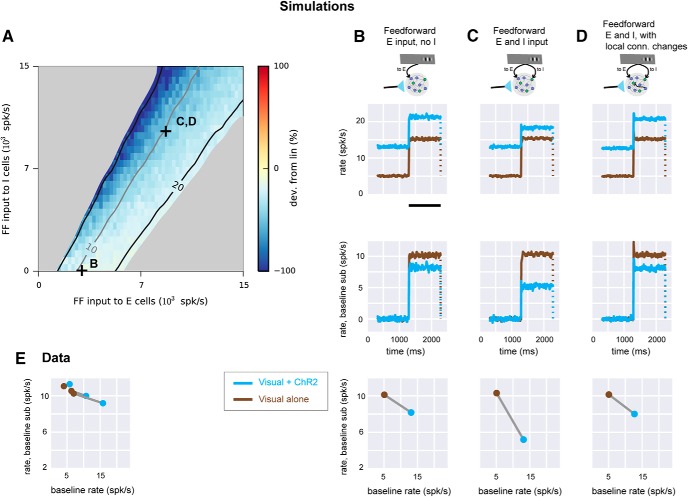
Figure 6.
Experimental linear scaling can be replicated in networks receiving feedforward inhibition. A, Simulation where conductance steps (ChR2 input) and feedforward Poisson trains (visual input) are combined. Strengths of feedforward E input (x-axis) and feedforward I input (y-axis) are varied while spontaneous rate is set to 5 spk/s. Connection sparsity is 2%. Other conventions as in Fig. 3B. Symbols (+) show values of E, I input used in B–D. B, Network responses when feedforward input is supplied to E cells only. Top row, network responses (mean of E cell rates). Brown, feedforward Poisson (visual) input only; cyan, conductance (ChR2) input combined with visual input. Conductance increase lasts for the full duration of the cyan trace. Visual input duration is shown by black bar (bottom of plot). Dotted line indicates rates return to previous baseline when feedforward input ends. Second row, same data as top row, with baseline rate subtracted. Third row, response (y-axis) as a function of rate before feedforward input begins (x-axis). C, Same network simulations with feedforward input to both E and I cells (parameters marked by C in A). D, network receiving feedforward input to both E and I cells, but with stronger local connections from E to I cells (compare Fig. 4, with similar effect for two feedforward Poisson inputs instead of feedforward input paired with conductance step as shown here). E, data from Fig. 1C plotted to show how responses scale as baseline is changed. Three lines (brown, no ChR2; cyan, with ChR2) are the three groups of recorded neurons shown in Fig. 1C.

