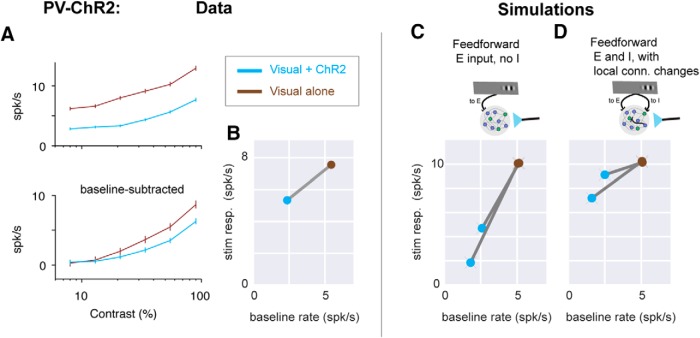
Figure 7.
PV-ChR2 stimulation data support the recurrent model with feedforward inhibition. A, Moderately sublinear scaling of visual responses is seen when PV neurons are optogenetically stimulated. (Data set previously reported in (Glickfeld et al., 2013)). Same conventions as in Fig. 1D. n = 43 units, 6 SU, 37 MU. B, Response sizes plotted as a function of baseline rate; same conventions as bottom panels in Fig. 6B–D. Stimulation of PV inhibitory neurons lowers baseline firing rates (here 2.3× reduction), so visual + ChR2 response (blue point) is to the left of visual only (brown). C, D, Model (with feedforward inhibition) that best fits E neuron stimulation data also describes moderate sublinearity seen in PV-ChR2 stimulation. C, Model with feedforward input to E cells only (same model as in Fig. 6B) shows very strong sublinearity. Two lines show two different strengths of optogenetic input to I cells (chosen to produce 2× or 3× decrease in baseline rates). D, Model with feedforward input to E and I cells and stronger local E-to-I connectivity (same model as in Fig. 6D), shows a range of sublinear scaling similar to that seen in the experimental data (A, B).

