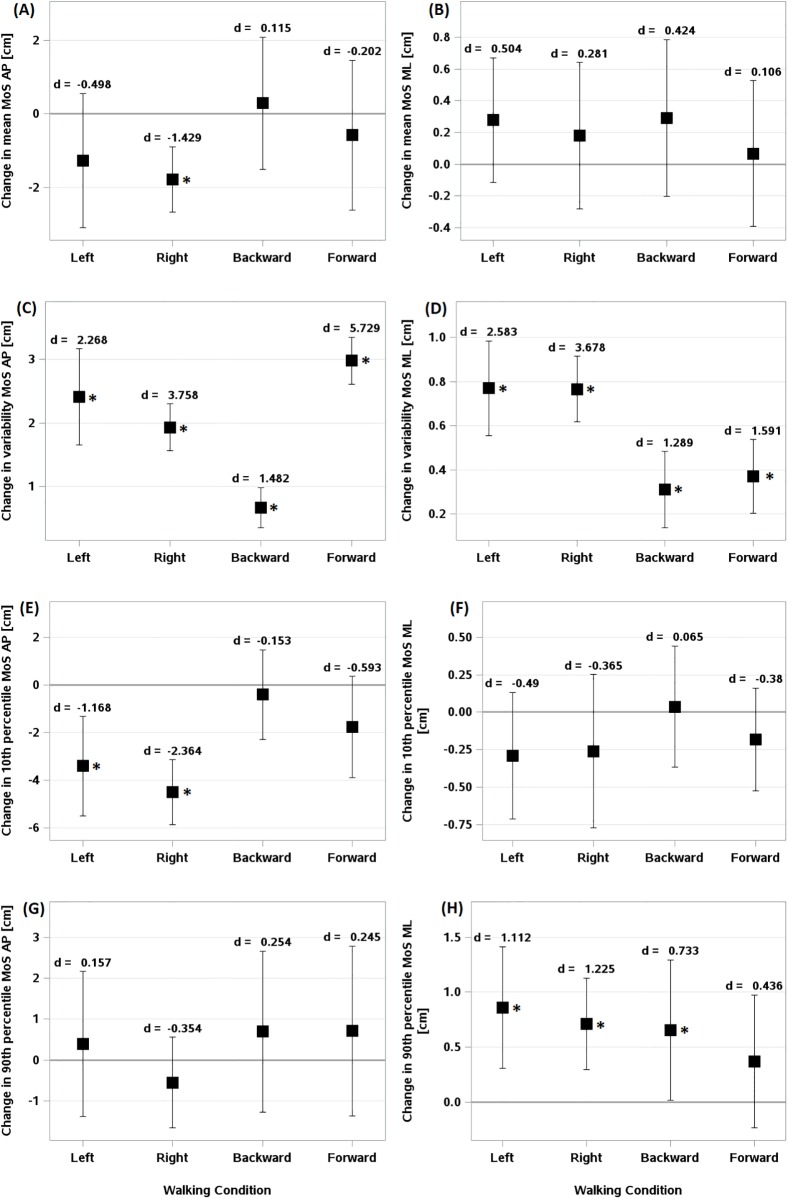
Fig 3. Difference of means, variability, and extremes of dynamic stability during perturbed walking conditions relative to normal walking.
Difference of means of (A) MoS-AP and (B) MoS-ML. difference of variability of (C) MoS-AP and (D) MoS-ML. difference of 10th percentile of (E) MoS-AP and (F) MoS-ML. difference of 90th percentile of (G) MoS-AP and (H) MoS-ML. d indicates Cohen’s d statistic effect size. Error bars indicate confidence intervals. (*) indicates statistically significant differences from Normal walking.

