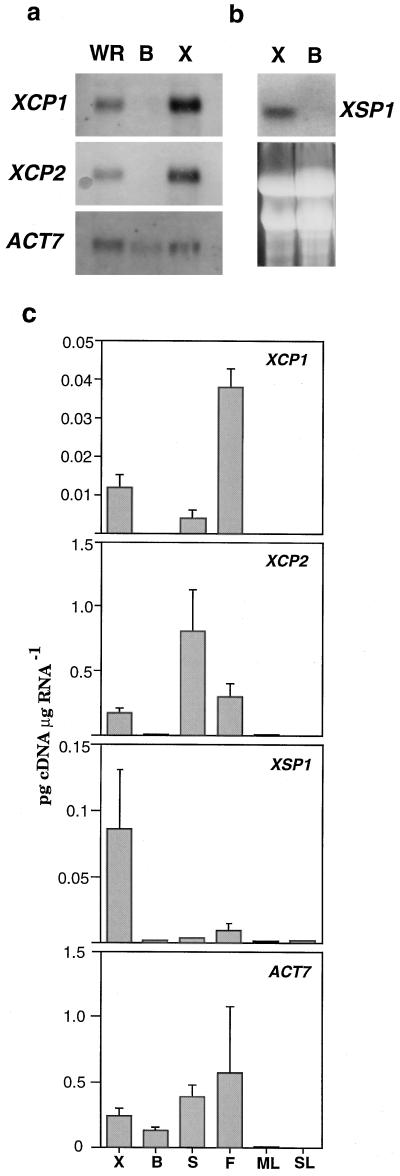
Figure 5.
RNA gel-blot and quantitative RT-PCR analyses of XCP1, XCP2, and XSP1 expression in organs and tissues of Arabidopsis. For XCP1, XCP2, and loading control ACT7, poly(A+) RNA (1.5 μg) isolated from whole root (WR), bark (B), and xylem (X) was separated by agarose gel electrophoresis, transferred to a nylon membrane, and hybridized with probes directly labeled with alkaline phosphatase, for visualization by chemiluminescence (a). For XSP1, total RNA (20 μg) from xylem and bark was hybridized with 32P-labeled probe (b). EtBr-stained RNA separated by agarose gel electrophoresis is shown to indicate levels of RNA transferred to nylon membrane for XSP1 analysis. For quantitative RT-PCR (c), total RNA was isolated from xylem and bark dissected from the root-hypocotyl, and from influorescence stems (S), flowers (F), mature leaves (ML), and senescing leaves (SL). Following reverse transcription of mRNA, cDNA from the indicated tissues and organs was used in six PCR reactions, each containing competitor cDNA of known concentration (dilution series of 10−1 to 10−6 ng/μL). The resulting PCR products were separated by agarose gel electrophoresis, and the density of EtBr-stained bands was determined. The values shown were determined from the intersection of curves depicting the levels of product from the competitor and levels of product from the target cDNAs. The values shown are means + sd determined from three independent RT-PCR experiments.

