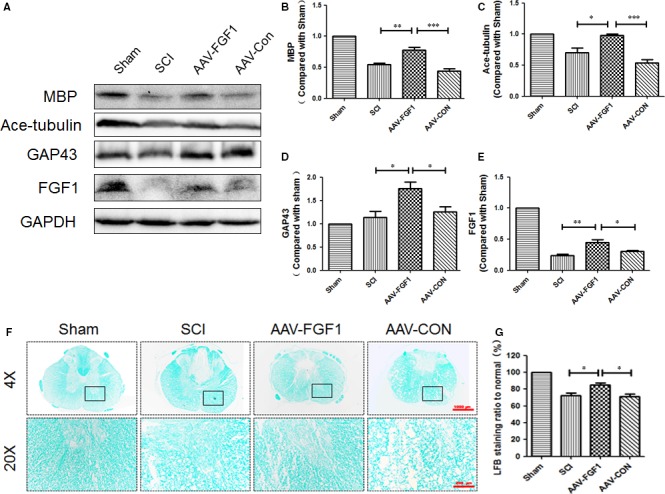
Figure 2.

AAV‐FGF1 promoted neuroprotection, axon regeneration and remyelination after spinal cord injury. A, Representative Western blot result of MBP, ace‐tubulin, GAP43 and FGF1 at 14 dpi in each group. B‐E, Quantification of Western blot data from A, ***P < .001; **P < .01; *P < .05. F, Representative images of white matter with LFB staining and transmission electron microscopy images of the myelin sheath at 14 dpi. Scale bar = 1000 μm (4×), Scale bar = 200 μm (20×). G, Quantification of LFB staining ratio to normal (%) from F, all data represent mean values ± SEM, n = 5, *P < .05
