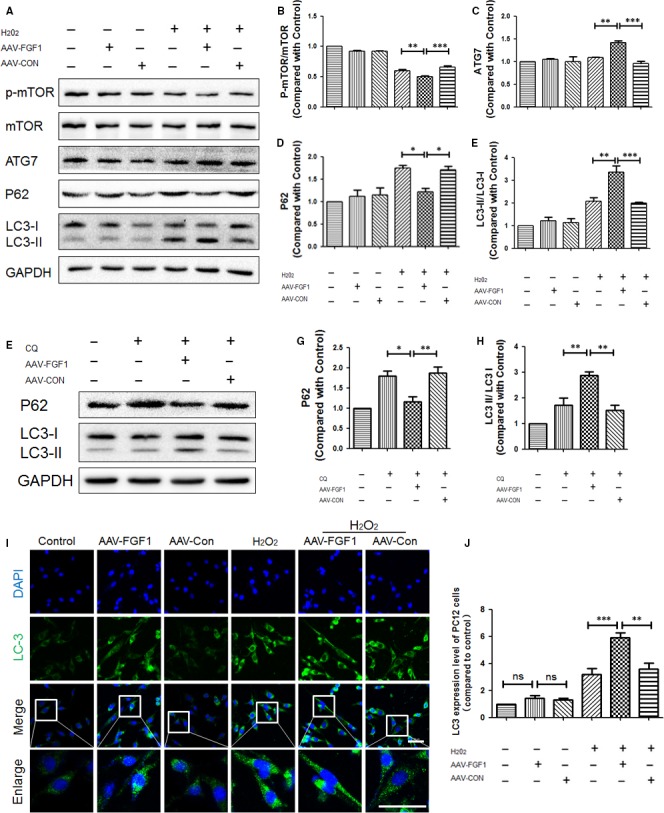
Figure 6.

FGF1 enhanced autophagy in vitro. A, Representative Western blot results of autophagy‐associated protein for each group of PC12 cells. B‐E, Quantification of Western blot data from A, ***P < .001; **P < .01; *P < .05. F, Representative Western blot results of P62 and LC3 for each group of PC12 cells treated with chloroquine and AAV‐FGF1. G‐H, Quantification of Western blot data from F, **P < .01; *P < .05. I, Immunofluorescence images show LC3 (green) in PC12 cells subjected to H2O2 (100 μmol/L) and treated with AAV‐FGF1. Scale bar = 50 μm. J, Quantification of fluorescence (level of LC3) from I, ns means “no significant difference”; ***P < .001; **P < .01
