Figure 2.

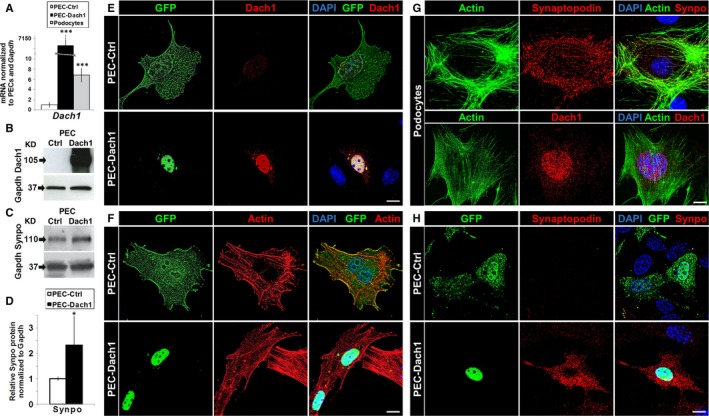
Expression of Dach1 in PECs induced an up‐regulation of the podocyte‐specific protein synaptopodin. A, Transfection of PECs with pDach1‐GFP (PEC‐Dach1: black bar, mean ± SD, n = 5) causes a strong Dach1 expression compared to cells transfected with pGFP (PEC‐Ctrl: white bar, mean ± SD, n = 5). In addition, Dach1 is up‐regulated to a comparable level as observed in podocyte cell culture (grey bar, mean ± SD, n = 5). B, Dach1 protein up‐regulation in PEC‐Dach1 was shown by Western blot analysis. C, Synaptopodin protein up‐regulation in PEC‐Dach1 was shown by Western blot analysis. D, Relative synaptopodin protein levels on Western blots were quantified for PEC‐Ctrl (white bar, mean ± SD, n = 5) and PEC‐Dach1 (black bar, mean ± SD, n = 5) and revealed an up‐regulation of synaptopodin protein for PEC‐Dach1. E‐H, Shown are either PECs (E, F, H) or podocytes (G). The up‐regulation of Dach1 (E) and synaptopodin (H) in PEC‐Dach1 was shown by immunofluorescence. F, Phalloidin staining was performed to analyse possible effects on the actin cytoskeleton, whereby no effects could be observed. Scale bars represent 10 μm (E‐H). Colours are green for GFP or Dach1‐GFP expression (E, F, H) or the actin‐cytoskeleton (G), red for either Dach1 (E, G), the actin cytoskeleton (F) or synaptopodin (G, H) and blue for DAPI‐stained DNA (E‐H). ***P < .001, **P < .01, *P < .05
