Figure 7.

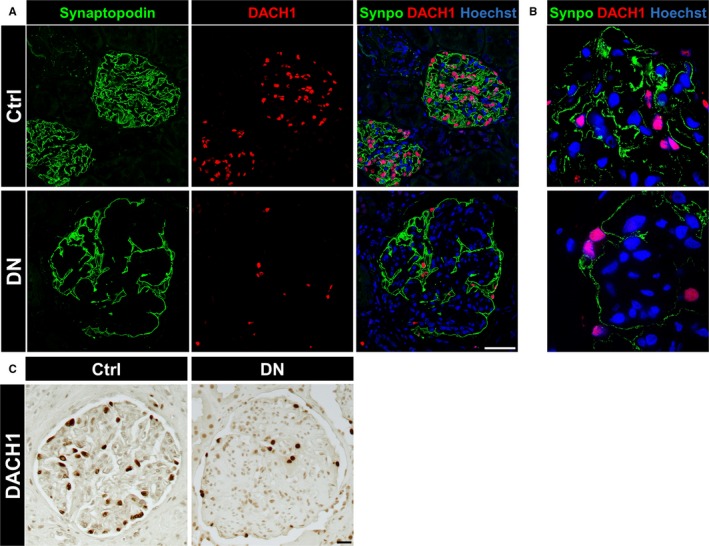
Diabetic nephropathy in human patients caused a severe down‐regulation of DACH1 and synaptopodin. A, The expression of DACH1 (red) and synaptopodin (green) was reduced in glomeruli of patients suffering from diabetic nephropathy (DN) as compared to control tissue (Ctrl) imaged by laser scanning microscopy (each n = 3). Scale bar represents 50 μm. B, Expression of DACH1 and synaptopodin in human kidneys imaged by super resolution microscopy (structured illumination microscopy—SIM). The expression of DACH1 and synaptopodin was reduced in DN patients in contrast to the controls. C, Immunohistochemistry of human kidneys showed the reduced DACH1 expression in DN compared to controls. Scale bar represents 20 μm
