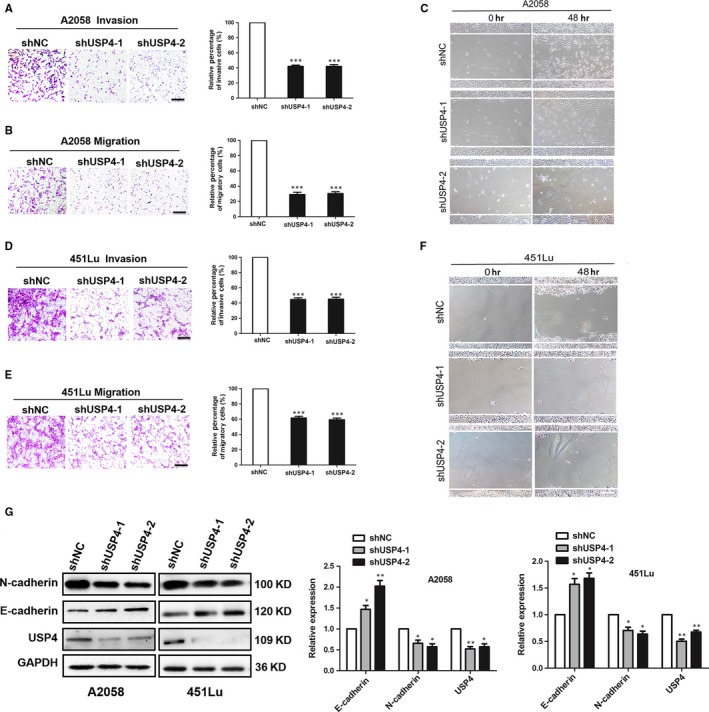
Figure 5.

USP4 promotes invasion and migration of melanoma cell through the induction of EMT. A and B, A2058 cells with indicated treatment were subjected to the invasion and migration assay. Representative fields of invaded and migrated cells are shown. Scale bar = 100 μm. The invaded and migrated cells were also quantified on the right. Data represent the mean ± SD of triplicates. C, A2058 cells with indicated treatment were subjected to wound‐healing assay. Experiments were repeated 3 times with similar results. Scale bar = 100 μm. D and E, 451Lu cells with indicated treatment were subjected to the invasion and migration assay. Representative fields of invaded and migrated cells are shown. Scale bar = 100 μm. The invaded and migrated cells were also quantified on the right. Data represent the mean ± SD of triplicates. F, 451Lu cells with indicated treatment were subjected to wound‐healing assay. Experiments were repeated 3 times with similar results. Scale bar = 100 μm. G, Expressions of N‐cadherin and E‐cadherin were analysed by immunoblotting. The right panel is a densitometry analysis of 3 individual experiments. Data are presented as the mean ± SD, *P < .05, **P < .01; Student's t test
