
Figure 7.
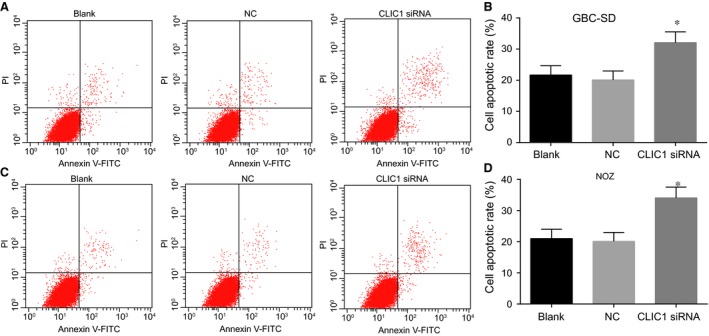
Cell apoptosis at 48 hrs after transfection in the CLIC1 siRNA, NC and blank groups by flow cytometry. (A, C) cell apoptosis of GBC‐SD and NOZ in the CLIC1 siRNA, NC and blank groups by flow cytometry; (B, D) the bar chart of GBC‐SD and NOZ cells apoptosis rate in the CLIC1 siRNA, NC and blank groups; *compared with NC and blank groups, P < 0.05.