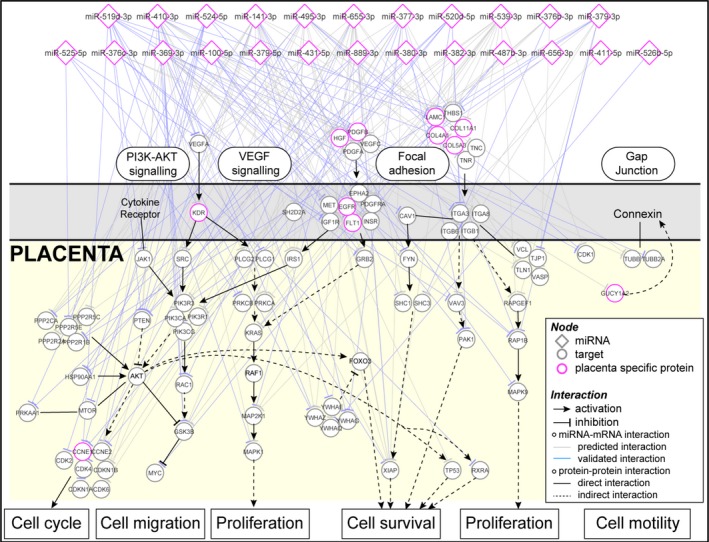
Figure 5.

Schematic diagram of perturbed gene network in placenta that may be reflected by the changes of circulating miRNAs in PTL. The network is built based on the KEGG pathway maps: focal adhesion (hsa04510), PI3K‐Akt signalling pathway (hsa04151), gap junction (hsa04540) and VEGF signalling pathway (hsa04370) which were from results of the enrichment analysis of miRNA targets. The genes are indicated by circles and miRNAs by diamonds. The predicted miRNA‐mRNA interactions are indicated by light grey lines, and the blue lines are validated miRNA‐mRNA interactions. The identity of genes and miRNAs involved in the process are indicated, and the red colour indicates placenta‐enriched mRNAs and miRNAs
