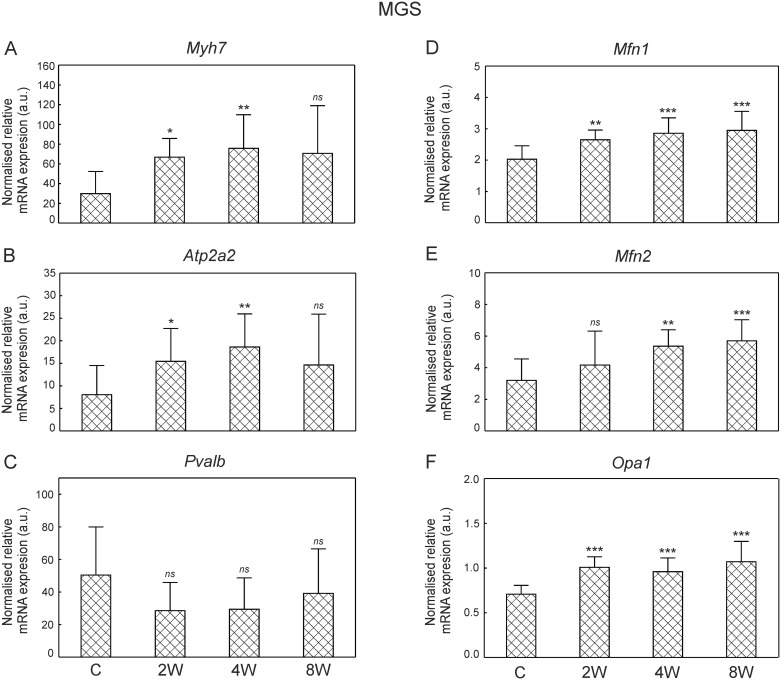
Fig 6. Relative mRNA expression levels in the MGS in control and trained animals.
Relative mRNA expression of myosin heavy chain slow isoform (Myh7, panel A), SERCA2 (Atp2a2, panel B), parvalbumin (Pvalb, panel C), mitofusin 1 (Mfn1, panel D), mitofusin 2 (Mfn2, panel E), mitochondrial dynamin-like GTPase (Opa1, panel F) in the slow part of the medial gastrocnemius (MGS) after 2, 4 and 8 weeks of endurance training. Data are presented as mean + SD normalized by the reference gene (Hprt1). One-sided p-value represents the statistical significance of the training period (2, 4 or 8 weeks) with respect to the control group (Dunnett’s post hoc test) (S10 File). The symbols * denote values significantly different: * p < 0.05, ** p < 0.01, *** p < 0.001.

