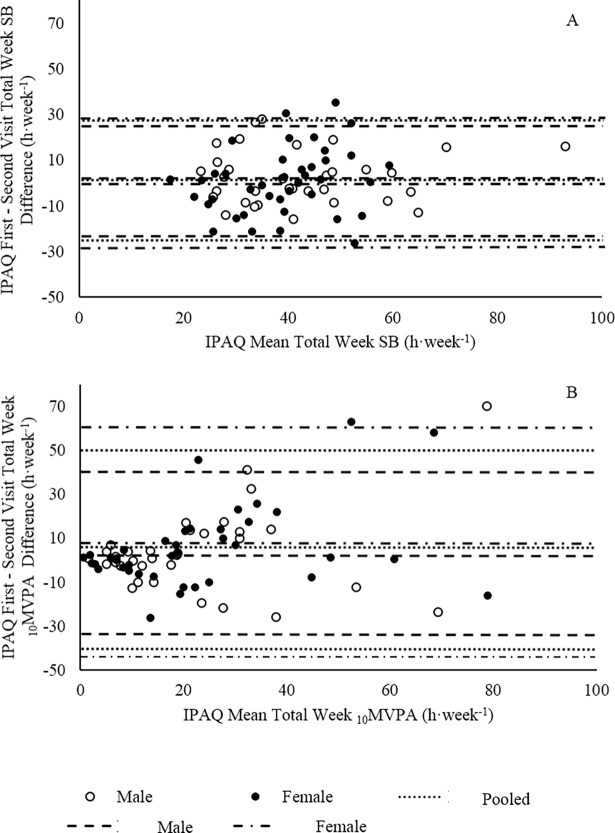
Fig 2. Reliability of the IPAQ expressed with Bland-Altman plots.
(A) Bland-Altman plot of the difference between First and Second Visit IPAQ data against the Mean of the First and Second Visit IPAQ data for Total SB. (B) Bland-Altman plot of the difference between First and Second Visit IPAQ data against the Mean of the First and Second Visit IPAQ data for 10MVPA. Lines represent systematic bias and 95% CI for pooled, male, and female populations.

