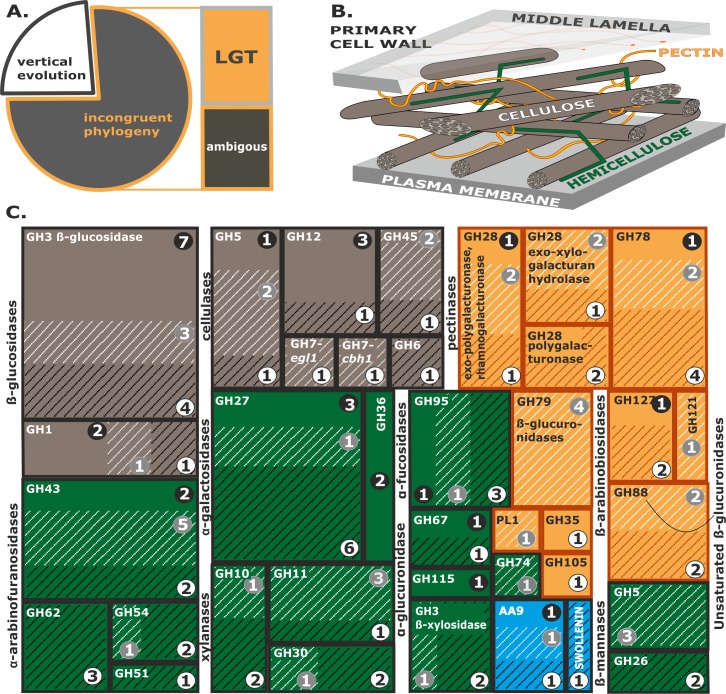
Fig 7. Composition and origin of the pcwdCAZome of Trichoderma based upon nine genomes.
A. Summary of the evolutionary analysis and tests for LGT of individual proteins in Trichoderma pcwdCAZomes (N = 122) presented in Supporting Information S3 Table–S4 Table, S2 Fig. B. Schematic drawing of the primary plant cell wall. Cellulose, hemicellulose, and pectin are colored brown, green, and orange, respectively. C: The diversity and evolution of individual groups of Trichoderma pcwdCAZome. Brown, green, and orange rectangles correspond to enzymes involved in the degradation of cellulose, hemicellulose, and pectin, respectively. See B for the legend. Auxiliary proteins are shown in blue. Dark-shaded lines correspond to genes obtained through putative LGT, while light-shaded lines indicate additional cases of incongruent phylogeny and/or insufficient data. Numbers on white, black, or grey backgrounds correspond to the maximum total numbers of genes in each family that evolved through LGT, vertical evolution, or unknown mechanisms, respectively.

